Jacob Morrow
Updated: 2025-09-17
Imagine launching a beautifully designed app, running an exciting marketing campaign, and watching the traffic roll in. But you only see users bounce without converting.
If this sounds familiar, then you already know that acquiring customers is just the beginning. The real battle lies in keeping them engaged. And what's worse than that is that most businesses struggle to measure engagement effectively.
This is where understanding and leveraging the right customer engagement metrics come in. From behavioral to emotional insights, the right data can transform your entire customer journey. Get a head start on customer engagement by keeping track of the key metrics we will cover in this piece.
Part 1: What Are Customer Engagement Metrics?
But what does the term metrics for customer engagement mean? In the category of customer engagement metrics, we are referring to quantifiable data that tracks how users interact with your brand across digital and physical touchpoints.
In more detail, they reflect user involvement, satisfaction, and loyalty, all elements that show the health of your customer relationships.
As you can see, metrics of customer engagement are crucial for any business across all industries. Whether you're tracking app opens, email click-through rates, or customer lifetime value, these metrics will help you align your marketing and product strategies. Ultimately, they will be the deciding factor in delivering what your customers want.
Metric Types
One thing you need to understand about customer engagement is that it is multi-dimensional. To get a complete picture, you need to track different metrics to measure customer engagement in all of its facets. Each one of them will be reflecting a unique aspect of how users interact with and feel about your brand. In general, we can group metrics into three distinct categories: behavioral, emotional, and revenue. Below, you will find detailed explanations, as well as customer engagement metrics examples for each:
#1 Behavioral Metrics
What They Reveal: These types of metrics for customer engagement show how users interact with your product or brand across touchpoints, such as what they click, where they go, and how often they return.
Why They Matter: These metrics provide data on real user activity, interest, and engagement. By tracking them, you will understand what users do on your app or website, and not just what they say.
✨Key Metric Examples✨

- Click-Through Rate (CTR): This measures how often users click on calls-to-action in emails, ads, or push notifications. A high CTR usually indicates that your links and buttons are relevant and appealing to your customers.
- Login Frequency: This metric tracks how often users sign in to your platform. If you notice a dip, then this could signify potential disengagement.
- Session Duration: This shows the average time users spend per session in your app or website. The longer the sessions are, the higher the engagement.
- Feature Usage: If you wish to go deeper, you can also track how frequently certain features are used. This metric will help you understand which parts of your product deliver value.
- Pages per Session: With this metric, you can find out how deeply users explore your site or app. More pages mean curiosity or intent, while fewer suggest confusion or poor UX.
- Event Tracking: You can set up different actions to count as an event, such as completing a tutorial, adding items to a cart, or submitting a form. These key actions will then be depicted in the event tracking metric.

#2 Emotional Metrics
What They Reveal: These metrics to measure customer engagement showcase how users feel about your product, service, or brand. For this reason, they track satisfaction, loyalty, frustration, and overall sentiment.
Why They Matter: Emotional engagement influences long-term loyalty and lifetime value. It's not just about what users do, but why they do it and why they keep on doing it.
✨Key Metric Examples✨
- Net Promoter Score (NPS): This invaluable metric reflects the likelihood that users will recommend your product to others.
- Customer Satisfaction Score (CSAT): This measures satisfaction immediately after an interaction. It is often answered by the question “How satisfied were you with your experience?”.
- Customer Effort Score (CES): This metric assesses how easy it was for the user to complete a task. If it indicated high effort, then there might be some potential friction points in the user journey.
- Feedback Sentiment: This particular metric analyzes qualitative feedback to determine emotional tone. For instance, it considers reviews and survey comments to reveal whether the sentiment is positive, neutral, or negative.

#3 Revenue Metrics
What they reveal: The final category of customer engagement metrics measures the financial impact of this engagement. In essence, it shows you how customer interactions translate into revenue, loyalty, and ROI.
Why they matter: T hese are some of the most important metrics that show you how your engagement efforts affect your business outcomes.
✨Key Metric Examples✨
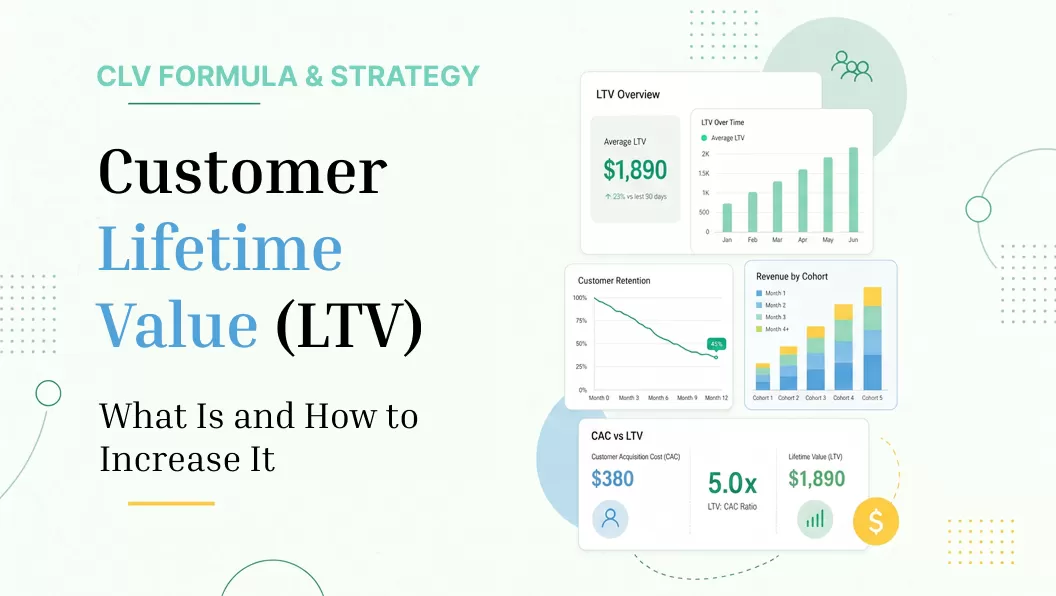
- Customer Lifetime Value (LTV): This is one that estimates the total revenue a customer is expected to generate over the entire relationship. It is an invaluable metric that combines the average purchase value, frequency, and retention.
- Conversion Rate: This metric measures how many users complete a desired action out of the total number of visitors. This action can be anything you would like to track, depending on your goals, such as signups, purchases, or even demo requests.
- Churn Rate: With this metric, you can see the percentage of customers who cancel or stop engaging over a set period. If this is high, then you are probably losing revenue from failing to engage your customers.
- Repeat Purchase Rate: This metric is more relevant in e-commerce compared to other industries. In reality, it tracks the percentage of customers who buy from you more than once.
- Average Revenue per User (ARPU): This is a breakdown of revenue per customer. By analyzing it, you can identify your highest-value segments.
Key Metric Differences Between B2B and B2C
Even though metrics for customer engagement are valuable across all industries, it is important to understand which ones to track. B2B and B2C businesses often focus on different ones because the nature of their customer relationships is very different. In this part, we are going to see the main differences between B2B and B2C.
#1 Sales Cycle Length
In B2C, the sales cycle is typically short and transactional. Customers tend to make quick decisions, often by clicking buttons on an email or tapping on a push notification. In B2B, though, the sales cycle is much longer, spanning weeks or months. Therefore, it requires a consultative approach that will convince all stakeholders.
#2 Engagement Frequency
In B2C, there is a higher volume of touchpoints that lead to faster interactions. For instance, many B2C brands need to track social media clicks, mobile app opens, or product browsing. In B2B, on the other hand, there are fewer touchpoints, while they manage to showcase deeper engagement. In these instances, conversions and feature usage are very important metrics.
#3 Primary Engagement Metrics
B2C brands prioritize metrics like views, click-through rates, session duration, app usage, CSAT, and churn rate. In a B2B setting, metrics like product adoption, Net Promoter Score (NPS), renewal rate, expansion revenue, and customer health scores make more sense.

#4 Preferred Channels
A B2C company will gather metrics to measure customer engagement from email, mobile apps, SMS, social media, and in-app messaging. B2B companies will focus on slightly different channels to collect data, such as email, CRM tools, personalized account manager interactions, and LinkedIn.
#5 Goal Orientation
In B2C, the focus lies on repeat purchases, upselling, and minimizing churn. Therefore, metrics like churn rate and repeat customer rate are critical. On the flipside, B2B businesses aim to build long-term relationships, increase account value, and secure contract renewals. For these brands, SaaS customer engagement metrics like customer lifetime value and customer satisfaction score are essential.
Part 2: From Clicks to Retention: Key Metrics for Customer Engagement
But which customer engagement metrics should you use? If you get that right, then you will be able to evaluate the success of your strategies and drive long-term loyalty. In this section, we have created a list of the most important customer engagement metrics that will put you on the road to success:
#1 Click-Through Rate (CTR)
What it is: CTR is the percentage of users who click on a link in an email, push notification, or ad after viewing it.
How to measure: (Number of Clicks / Number of Impressions) × 100
EngageLab provides you with real-time email analytics that include numerous stats, including CTR. Therefore, any time you send a campaign containing a link or button, you can view how many clicks it has.
#2 Daily/Monthly Active Users (DAU/MAU)
What it is: This refers to the number of unique users who engage with your product daily or monthly. EngageLab's guide to growing active users is an excellent starting point for understanding these metrics of customer engagement.
How to measure: MAU = Number of unique users in 30 days. DAU = Number of unique users per day.
#3 Net Promoter Score (NPS)
What it is: As we've already seen, this shows you how likely users are to recommend your brand to others. In EngageLab, you can create beautiful and professional-looking campaigns to request feedback from your customers, which will help you determine this metric.
How to measure: You can send questionnaires containing the question: “On a scale of 0–10, how likely are you to recommend us?” Then, subtract the percentage of detractors from promoters.

#4 Conversion Rate
What it is: As one of the most important customer engagement metrics examples, this metric shows the overall conversions.
How to measure: (Number of Conversions / Number of Visitors) × 100
Part 3: 2 Industry-Specific Customer Engagement Metrics Examples
To help you better understand which ones you should choose, we are going to go through two customer engagement metrics examples from different industries:
SaaS Customer Engagement Metrics
For SaaS businesses, engagement is often the clearest predictor of long-term retention and upselling opportunities. For this reason, the key SaaS customer engagement metrics include:
- Feature Adoption Rate: this measures whether users are using the tools they're paying for, an invaluable knowledge for contract renewal.
- Onboarding Completion Rate: With this, you can track if users complete the initial setup/tutorials, or if you should set up an automated user journey to go through the steps your customers need to take.
- Net Revenue Retention (NRR): This metric monitors the changes in your recurring revenue from existing customers over a set period.
E-Commerce Customer Engagement Metrics
In e-commerce, you are in a highly competitive industry, where your customers' attention spans are short. By using Gupshup customer engagement metrics, or any other tool, you can keep your customers coming back to your brand for more. The key metrics in this industry are:
- Cart Abandonment Rate: This metric shows you the percentage of users who added items to the cart but didn't complete the purchase.
- Repeat Purchase Rate: This metric reflects the percentage of customers making multiple purchases from you. This shows you your loyal customers who like your brand.
- Net Promoter Score (NPS): This is an invaluable metric for every e-commerce brand as they want their customers to recommend it via word of mouth or social media.
Part 4: How EngageLab Transforms Metrics into Action
Once you collect the data from these metrics for customer engagement, the real value lies in acting on it. In EngageLab , you don't just gain access to detailed analytics on your every campaign, but you can also directly apply the necessary changes across multiple channels.
EngageLab Function
In short, EngageLab brings you:
- Real-Time Dashboards: Track KPIs like open rates, clicks, and delivery rates on your campaigns. And the greatest thing of all is that you can view these stats for your campaigns across all channels.
- Automated Workflows: Easily turn your engagement insights into timely actions. For instance, you can trigger re-engagement emails to users who haven't logged in for 7 days, send surveys after support interactions, or deliver cross-sell offers based on recent purchases.
- Cross-Channel Attribution: Understand which channels are driving the most engagement. In EngageLab, you can reach out to your customers via email, push notifications, SMS, and WhatsApp.

Competitive Advantage
In the era of data-driven marketing, customer engagement metrics are your secret weapon, and EngageLab provides you with a competitive edge. Whether you're a SaaS platform looking to reduce churn or an e-commerce brand focused on maximizing lifetime value, it allows you to adopt a more holistic approach. Use EngageLab to collect data from its real-time statistics and translate them into actionable, automated, meaningful actions that boost retention, loyalty, and revenue.