Push Statistics
Conversion Analysis
Parameter Description
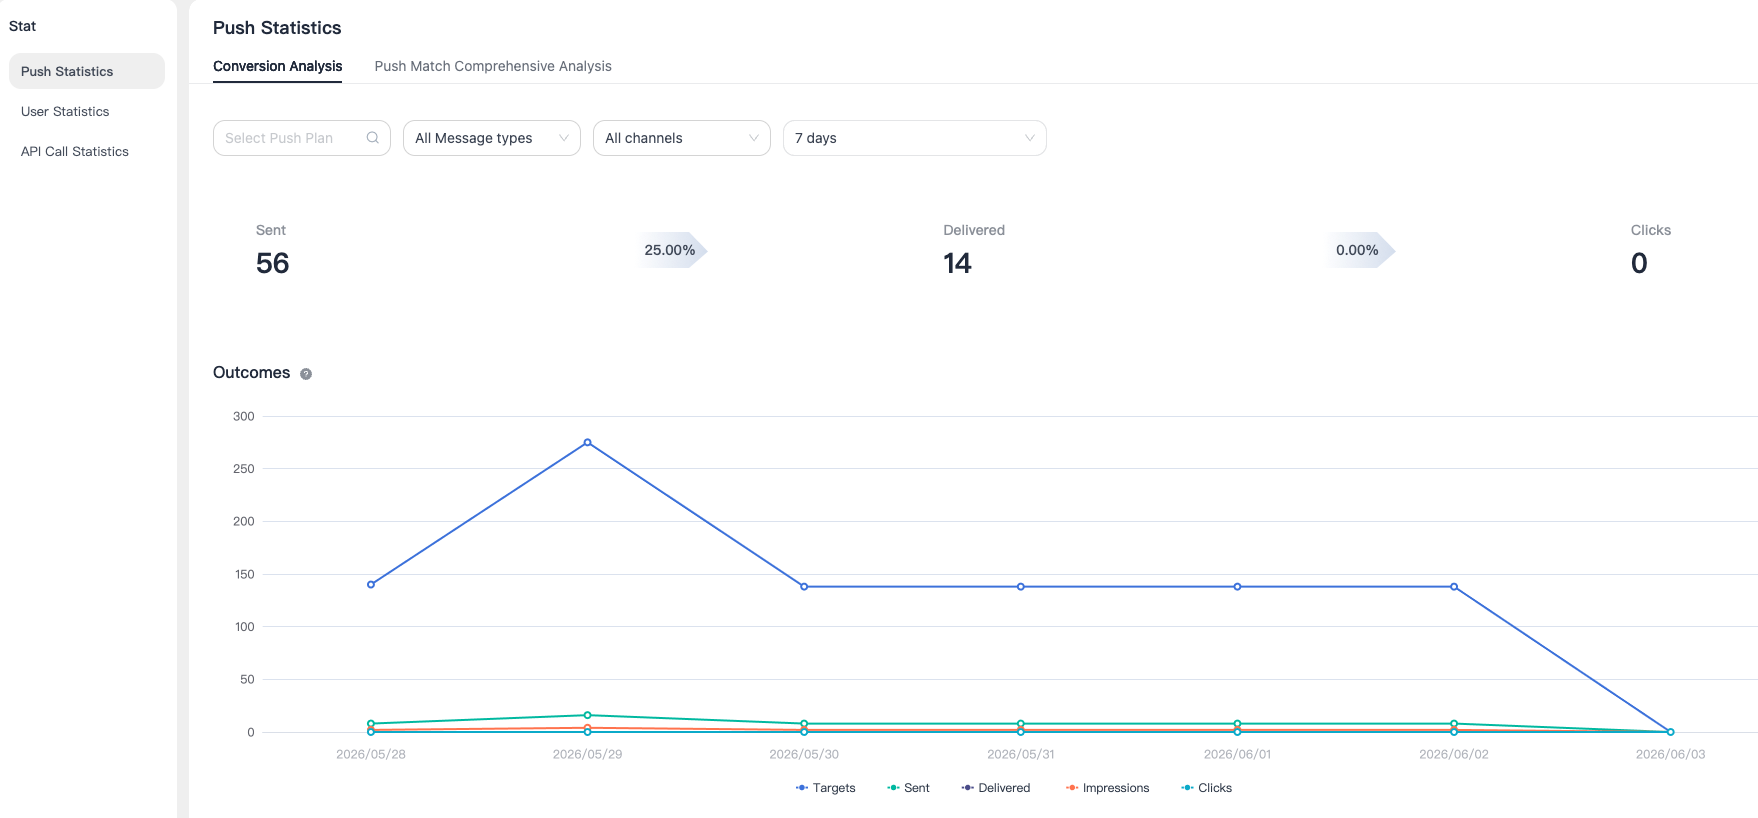
Go to Statistics > Push Statistics to view charts and detailed data for push targets, push volume, user clicks, and custom clicks. You can filter the data by date.
- Delivery rate: For sending tasks created during the selected period, total deliveries divided by total sends.
- Click rate: For sending tasks created during the selected period, total clicks divided by total deliveries.
- Valid targets: The number of target devices remaining after the audience selected for the push task has been checked for validity.
- Sends: The number of valid target devices for which the EngageLab server successfully created a sending task.
- Deliveries: The number of notifications actually delivered to devices after sending. Deliveries after 5 days are excluded.
- Impressions: The number of notifications successfully displayed on devices after delivery. Impressions after 5 days are excluded.
- Clicks: The number of notifications clicked by users after successful display. Clicks after 5 days are excluded.
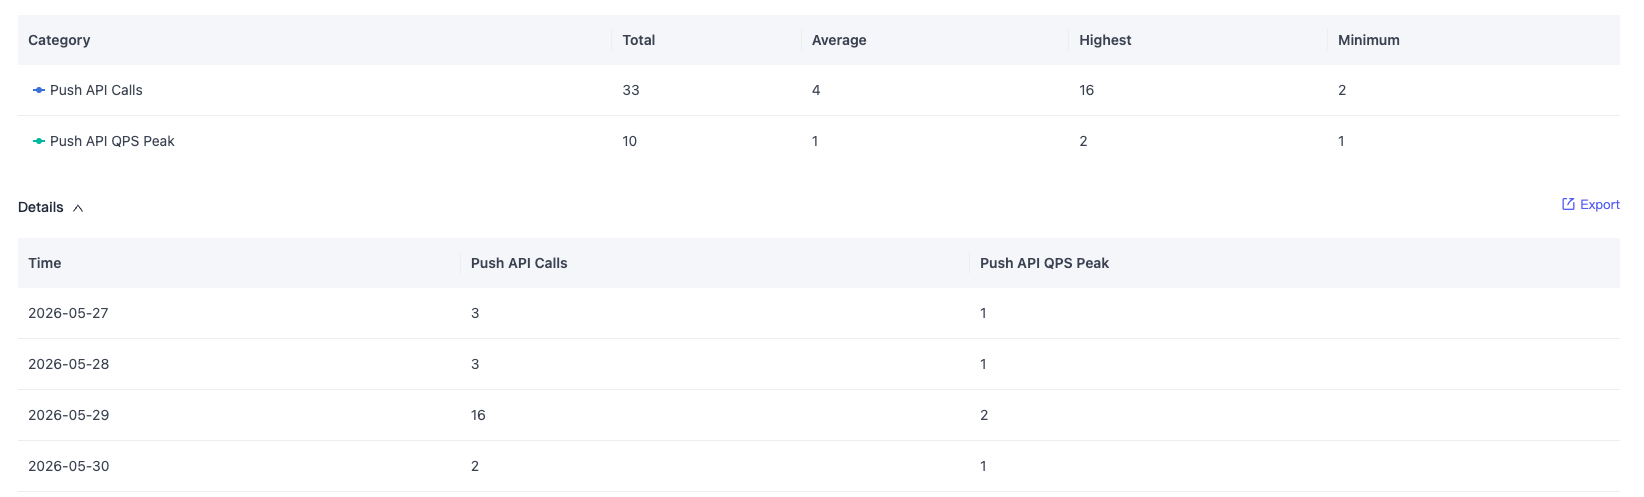
Export Data
Click Export on the right to export detailed data.
Push Match Comprehensive Analysis
Parameter Description
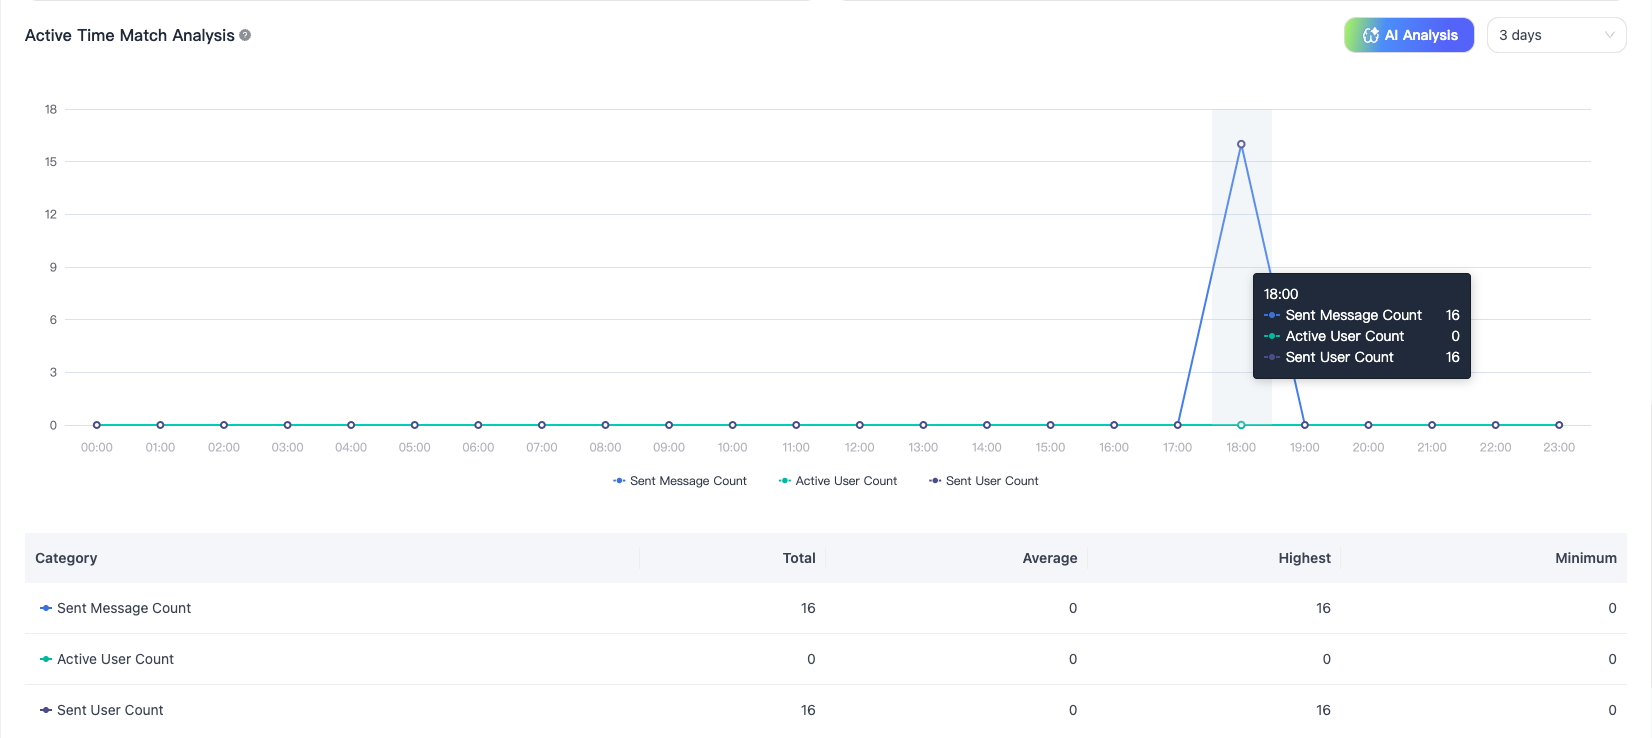
- Push language/region match: Compare user activity times with your push sending times to identify timing differences and optimize when you send.
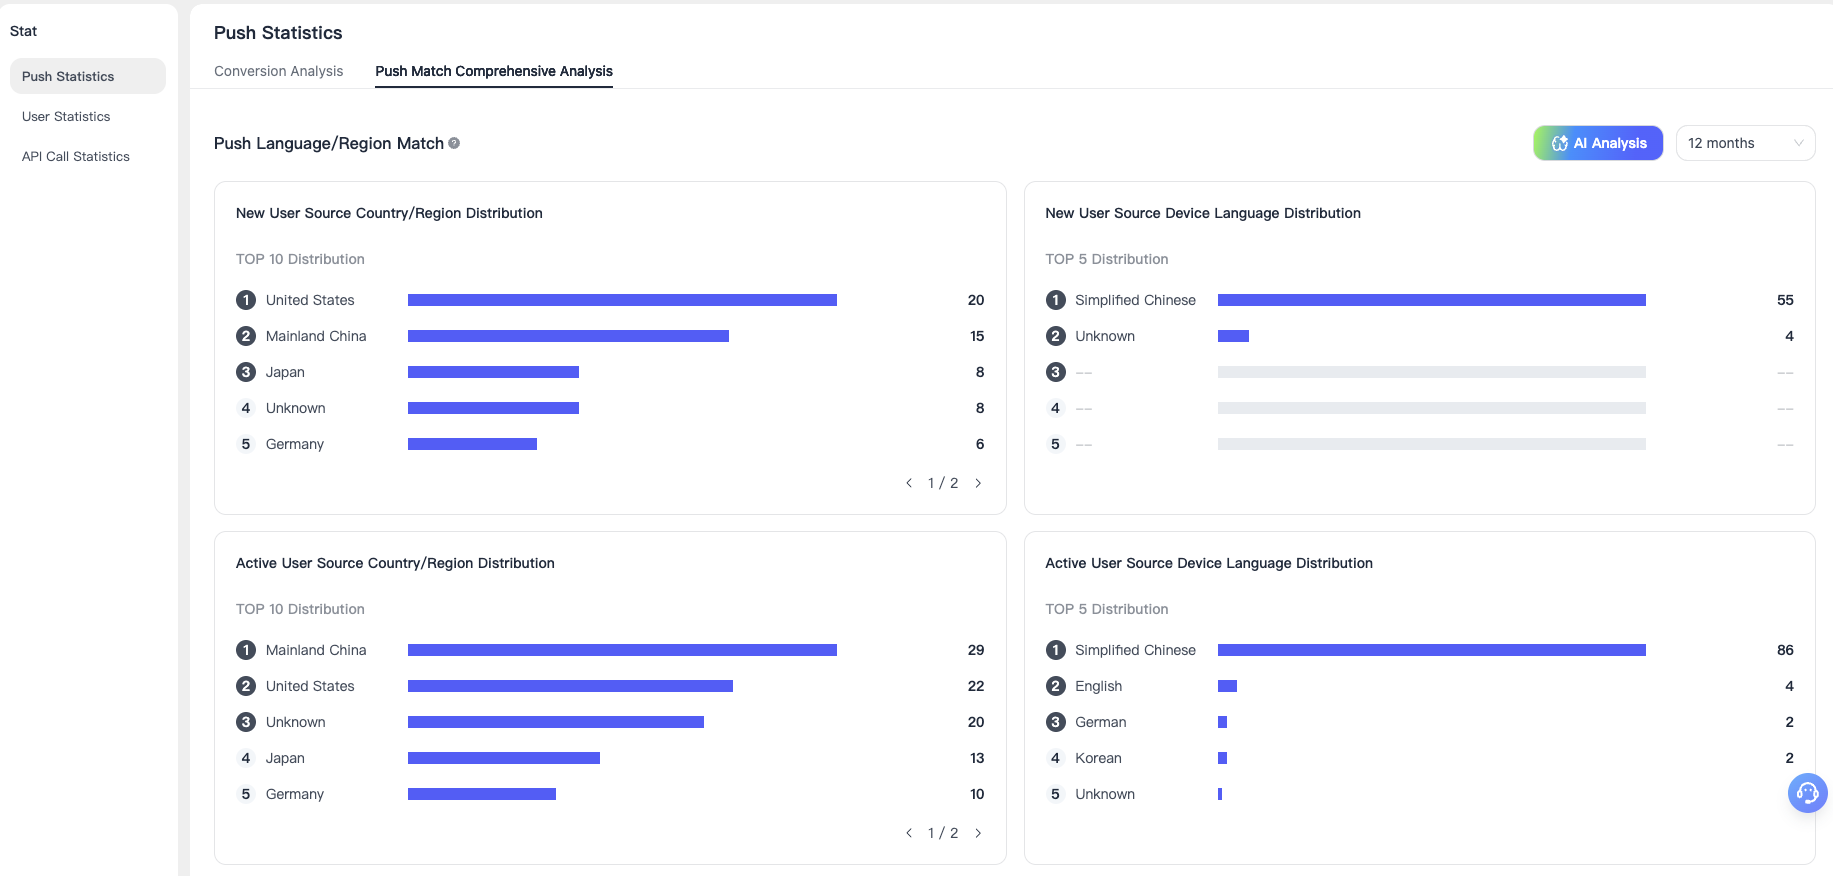
- Active time match analysis: Use the language/region distribution of new and active users to adjust your push strategy for better results. Some devices cannot report this information, so the data is for reference only.
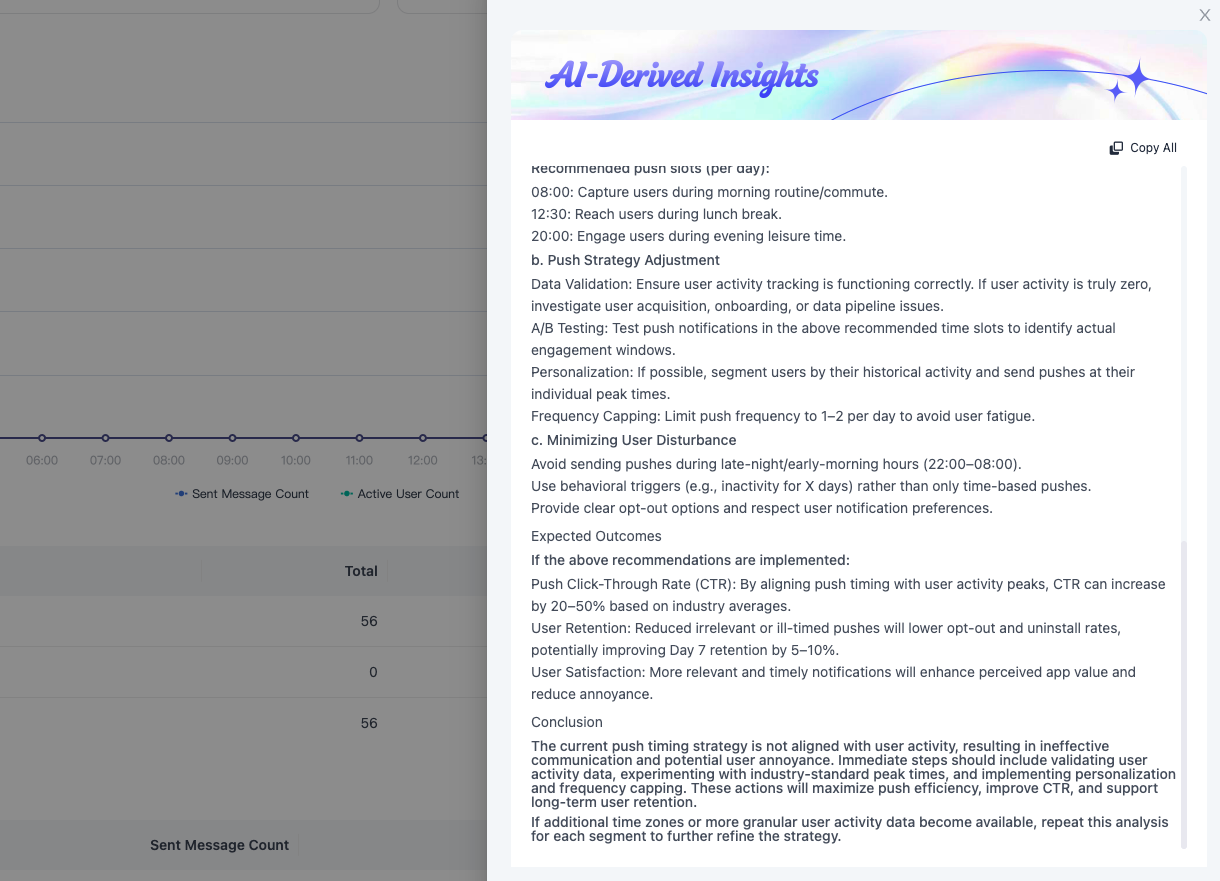
AI Insights