

How to Analyze the Performance Data of a Single Message Component?
1. Operating Steps
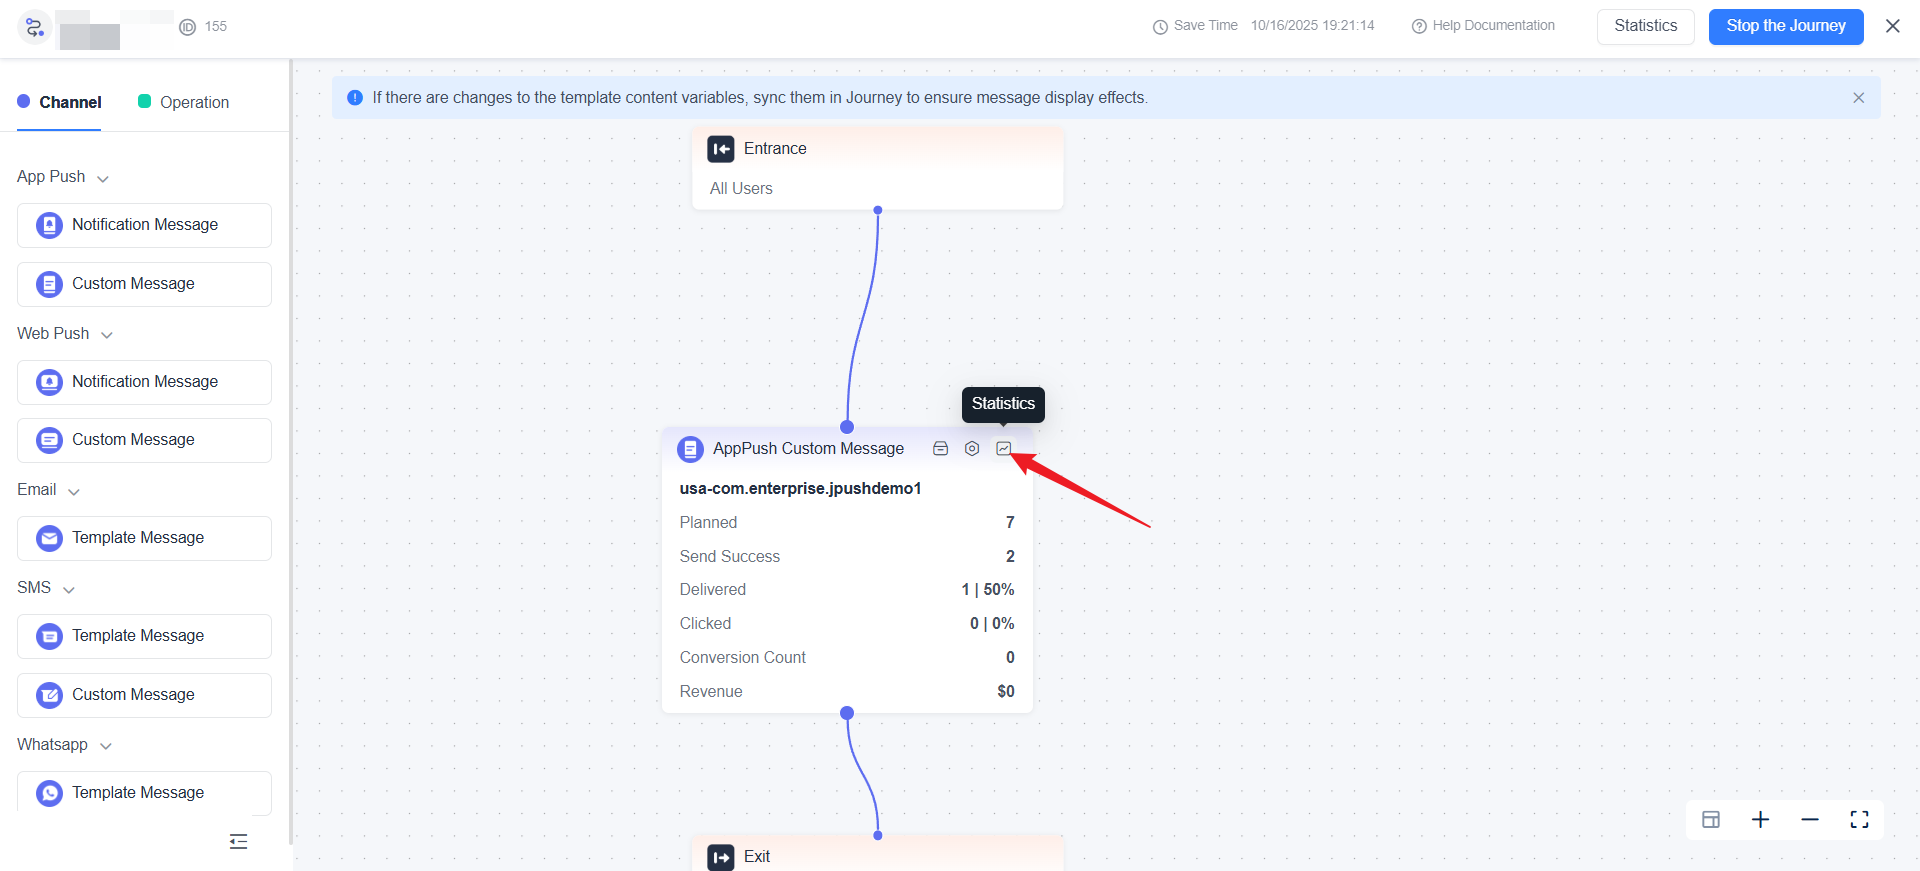
On the canvas of a published journey, click the Statistics button icon in the upper-right corner of the target message component. (Refer to the image below for the icon location.)
2. View the following core metrics:
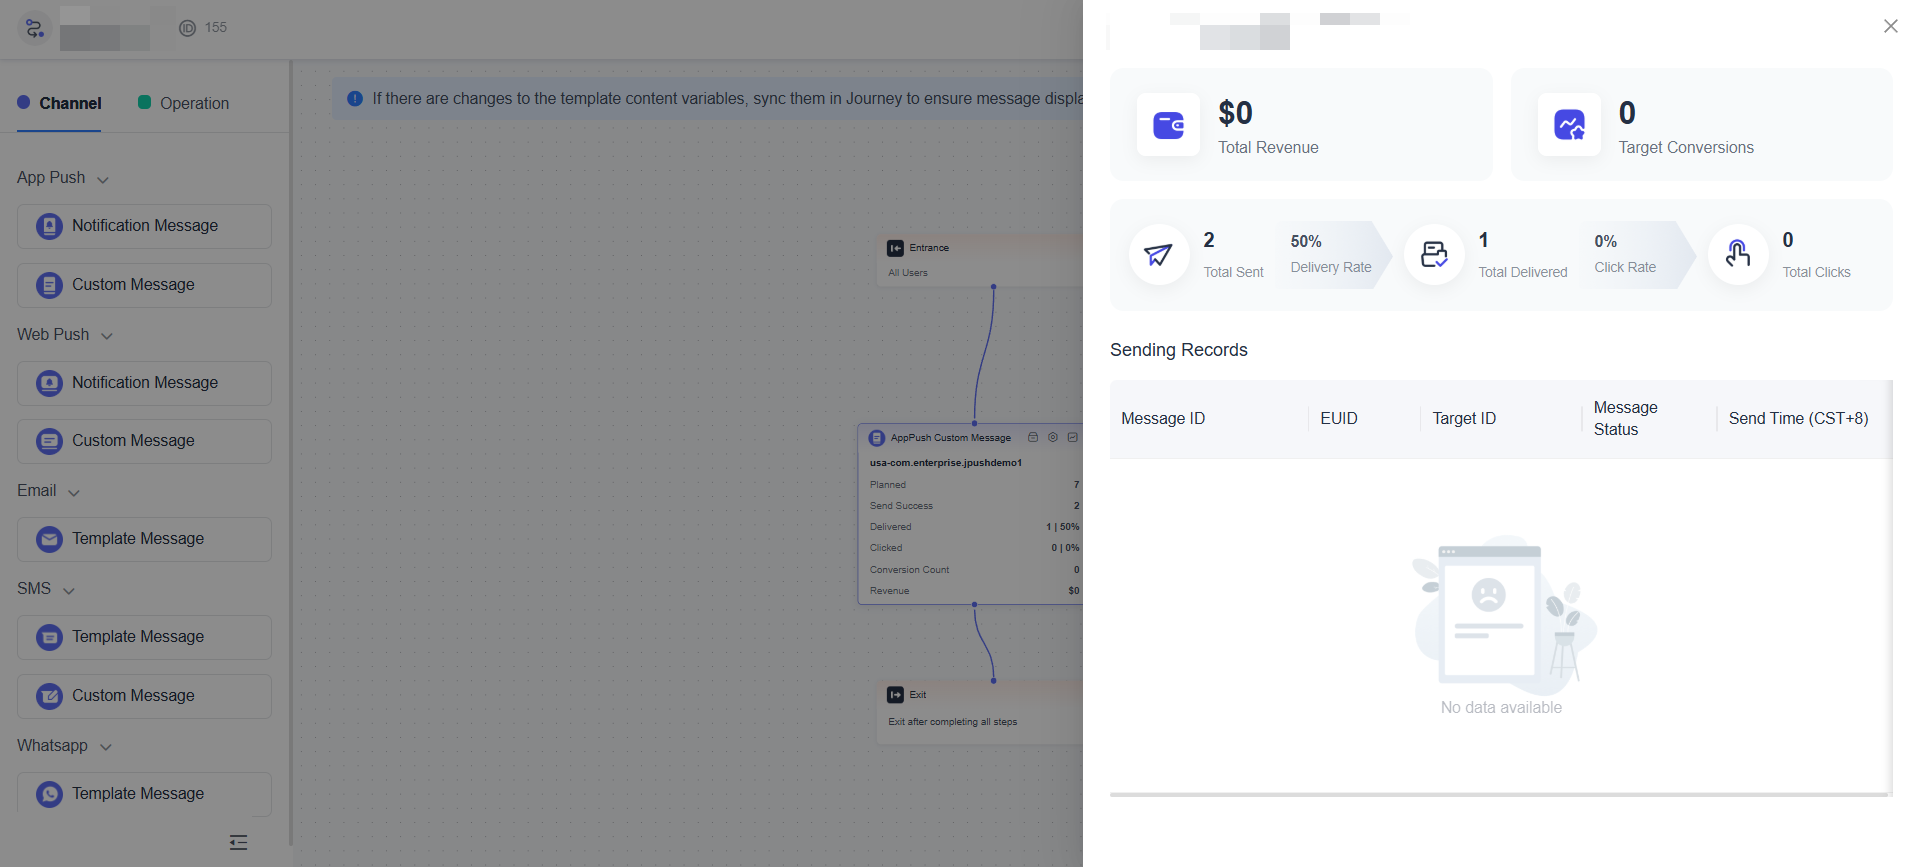
- Delivery & Reach: Total sent, total delivered, total clicks.
- User Engagement: Delivery rate, click-through rate.
- Conversion Value: Target conversions, total revenue (displayed when revenue attributes are configured).
3. Common Issues & Optimization Recommendations
- Low delivery rate: Check channel configuration (e.g., Token/key validity, device status).
- Low click-through rate: Optimize copy titles, content layout, or delivery timing.
- Low conversion rate: Improve landing page experience or refine user guidance paths.
EngageLab MA enables users to quickly pinpoint issues and implement precise optimizations through component-level data analysis.

Still Have Questions?
Can't find what you're looking for? Our experts are here to provide personalized assistance. Ask your question now and get a timely response.

