

How to View Core Data Metrics for User Journeys?
1. Access Path
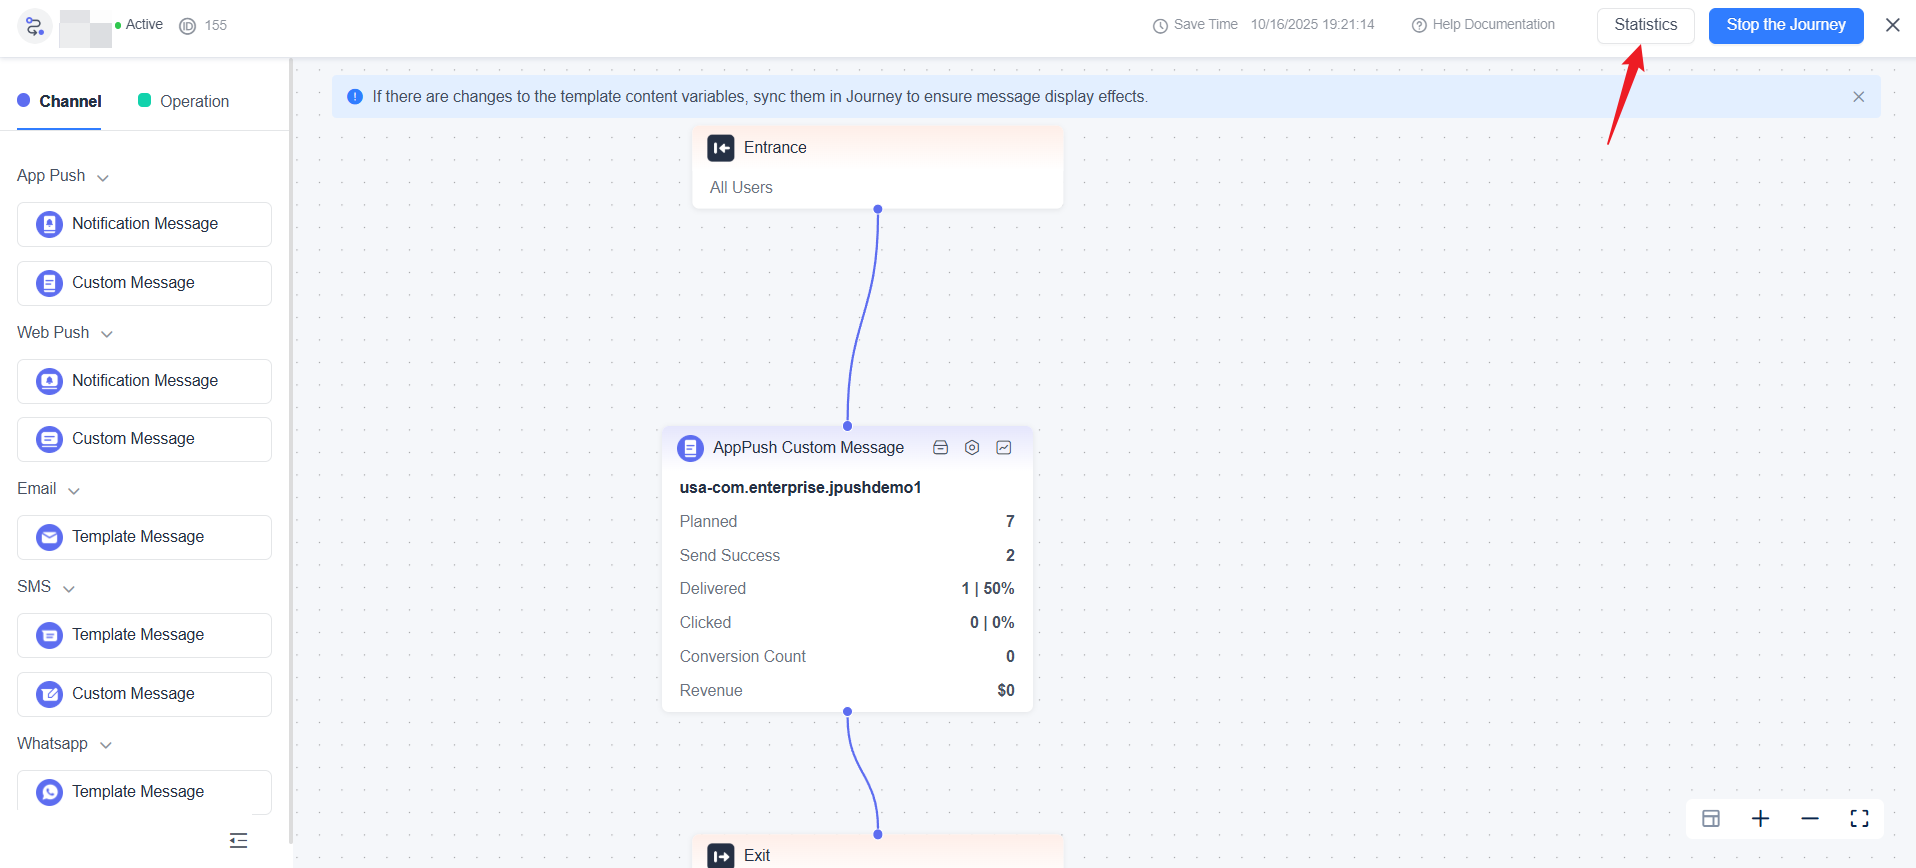
- Go to the details page of the target journey.
- Click the "Statistics" tab in the upper right corner (data is visible only for published journeys).
2. Core Metrics
- Participation Count: Total number of user entries into the journey (repeated entries by the same user are counted multiple times).
- Conversion Rate: Proportion of users who completed the target action (the target action is set at the beginning of the journey).
- Completion Rate: Proportion of users who completed all steps until the journey ended (completion count/participation count).
- In Progress: Number of users currently still in the journey, neither completed nor exited.
3. Analysis Recommendations
- Focus on trends in conversion rate and completion rate to evaluate the overall effectiveness of the journey.
- Combine sending and conversion data from each message component to identify optimization points.
EngageLab MA helps users continuously improve journey design and operational efficiency through systematic data insights.

Still Have Questions?
Can't find what you're looking for? Our experts are here to provide personalized assistance. Ask your question now and get a timely response.

