Elena Rodriguez
Updated: 2026-11-10
A support dashboard can look healthy even when customers are still waiting too long or receiving incomplete answers, despite contacting the team twice about the same issue.
A quick first reply is useful, but it says little about whether the problem was solved. Similarly, a high resolution count looks productive, but not if conversations keep reopening.
Choose a small set of customer service metrics that show response speed, resolution quality, customer sentiment, and workload together, instead of adding more numbers to the dashboard. Plus, the team must know what to investigate when one changes.

Part 1: What Customer Service Metrics Measure (and Which Ones Matter)
Quick answer: Customer service metrics measure how fast a support team responds, how well it resolves issues, how customers rate the outcome, and how much work the team handles. Start with five to seven customer service KPIs across speed, resolution, quality, and workload. Use more detailed measures to diagnose problems when they occur to avoid crowding the main dashboard.
| Metric Group | Management Question | Practical Indicators |
|---|---|---|
| Speed | How long does a customer wait? | First response time (FRT), customer wait time |
| Resolution | Was the issue solved without unnecessary repeat contact? | Average resolution time, first contact resolution (FCR), resolved count |
| Quality | Was the customer satisfied with the service? | Customer satisfaction (CSAT), survey response rate |
| Workload | Is demand outpacing the team's capacity? | Conversation volume by channel, unresolved backlog, hand-off rate |
Pick one metric from each group to start, then add a second for whichever group your team struggles with. Or you can start with a dashboard that includes FRT, resolution time, FCR (when it can be validated), CSAT, channel volume, and unresolved workload.
Net Promoter Score (NPS) and Customer Effort Score (CES) are survey measures of the wider customer relationship. This guide sticks to the customer support metrics your conversation data can calculate directly.
Part 2: The Core Customer Service Metrics & Their Formulas
Customer service metrics become useful when you understand what each number measures, and what it might be hiding. A faster response does not always mean better service, just as a higher resolution count does not guarantee that customers received complete answers.
The following eight customer service metrics examples cover response speed, resolution, customer satisfaction, and support workload. Each includes a formula or counting rule, the direction of a healthy trend, and where to review the relevant data in LiveDesk.
| Metric | Formula | Healthy trend | Misleading when | Where to find it in LiveDesk |
|---|---|---|---|---|
| First response time (FRT) | Sum of (first reply − conversation start) ÷ conversations | Steady or falling per channel | Automated greetings count as replies, or averages hide a slow tail | Insight Analysis → Conversations |
| Average resolution time | Sum of (resolved − start) ÷ resolved conversations | Falling, or flat while volume grows | Customers who reply days later stretch it | Insight Analysis → Conversations |
| First contact resolution (FCR) | Resolved on first contact ÷ all conversations × 100 | Rising alongside CSAT | Reopened chats and customers who give up look like wins | Custom analysis using Report Center |
| Customer Satisfaction (CSAT) | Satisfied responses ÷ all responses × 100 | Stable, with a healthy response rate | Only resolved conversations get surveyed, and few customers may respond | Insight Analysis → CSAT |
| Customer wait time | Average time a customer waits for a reply (confirm your tool's definition) | Falling throughout the conversation | A quick first reply hides lengthy waits between later messages | Insight Analysis → Conversations |
| Conversation volume by channel | New conversations per channel per period | Matches your staffing plan | Channel changes or different counting rules make volumes difficult to compare | Insight Analysis → Channels |
| Unresolved backlog | Conversations still open right now | Flat or shrinking | Snoozed conversations hide workload | Overview and Report Center |
| Transfer / hand-off rate | Conversations passed to a human or another team ÷ total × 100 | Stable, or falling for human-to-human transfers | A very low AI hand-off rate can mean customers gave up | Overview → AI Agent panel (AI to human only) |
How to Read These Customer Service KPIs

1 First Response Time (FRT)
FRT measures how long customers wait for an initial reply. A lower FRT is better, but automated acknowledgments can make response times appear faster without providing useful assistance. Read it per channel. A blended figure hides the fact that chat and email run on different clocks.
2 Average Resolution Time
Shorter resolution times suggest greater efficiency, but complex issues naturally take longer. Compare similar issue types and account for reopened conversations to avoid misleading results.
3 First Contact Resolution (FCR)
FCR measures issues resolved without repeat contact. Higher rates indicate effective support, but premature closures or untracked follow-ups can inflate results. Decide upfront whether a reopened conversation still counts as resolved on first contact, and keep that rule fixed. Watch it next to CSAT.
4 Customer Satisfaction (CSAT)
CSAT measures the percentage of customers satisfied with their support experience. Higher scores are desirable, but low survey participation can make results less representative.
5 Customer Wait Time
Customer wait time measures delays throughout a conversation, including follow-up responses. Compare it with resolution time to identify staffing shortages or unnecessary transfers.
6 Conversation Volume by Channel
This tracks support demand across chat, email, and messaging platforms. Increasing volume may reflect business growth rather than poor performance. Compare channel traffic with staffing capacity and response times.
7 Unresolved Backlog
Backlog represents conversations still awaiting resolution. A growing backlog may signal insufficient capacity, while declining numbers can be misleading if issues are closed prematurely.
8 Transfer / Hand-off Rate
This customer service metric measures how often AI transfers conversations to human agents. A rising rate shows where routing or AI knowledge is failing. Sample a few transferred conversations to see why they moved.
Apply LiveDesk's Conversation Counting Rules
EngageLab LiveDesk uses five statuses: Open , AI-Replying , Snoozed , Resolved , and Closed .

Keep these reporting rules in mind:
-
Resolved and CSAT: Moving a conversation to Resolved can trigger a satisfaction survey, depending on your account and channel settings. Sending the survey doesn't close the conversation, because automatic closure is a separate setting.
-
Closed conversations: They are excluded from the active conversation count, though the Efficiency trends still chart closed conversations over time. A new message can reopen them.
-
Reporting timestamps: New conversations use creation time and resolved conversations use the time their status changed, so the two don't match one-to-one. If new conversations keep outpacing resolved ones, work may be piling up.
-
Reopened conversations: If a conversation is reopened and resolved again, Efficiency counts the second resolution as a new resolution-time sample. Time after a conversation is resolved or closed isn't included.
Also, avoid universal response-time benchmarks. Set separate baselines for chat and email, and evaluate speed alongside resolution quality and customer satisfaction.
Part 3: Agent Performance Metrics That Don't Get Gamed
An agent who resolves more conversations isn't delivering better support. Some cases reopen, while others require multiple follow-ups. Similarly, faster replies mean little if customers remain dissatisfied.
The best agent performance metrics balance productivity with service quality and workload. Avoid ranking agents by a single KPI. Pair related metrics to understand what is actually happening and prevent misleading results.
Pairing Agent Metrics to Prevent Misleading Results
| Agent performance metric | Pair it with | What the combination reveals |
|---|---|---|
| Resolved conversations | Reopen rate | Whether cases stay resolved or customers return with the same problem |
| First response time (FRT) | CSAT | Whether faster replies also deliver satisfactory support |
| Positive rating rate | Rating response count | Whether satisfaction reflects enough customer feedback |
| Online vs. busy duration | Open and unhandled conversations | Whether agent availability aligns with workload |
| Open/unhandled load | Response and resolution times | Whether pending work is causing service delays |
| Resolution time | Issue complexity and customer wait time | Whether longer handling reflects difficult cases or process bottlenecks |
The rule is simple. Never reward speed without checking quality, or resolution volume without checking whether issues return.
How to Review Agent Performance in LiveDesk
LiveDesk provides an agent performance dashboard through its Overview and Insights reports.
Step 1: Check Overview → Agent Work Analysis
Review each agent's Open, Unhandled, In progress, and Resolved conversations alongside Online and Busy duration. These indicators help identify uneven workloads and possible staffing gaps.

The dashboard also calculates positive rating rate as:
Positive rating rate = (Satisfied + Very satisfied) ÷ All valid ratings × 100
In this report, Unhandled refers to Open conversations without replies. AI replies also count when determining whether a conversation has been answered.
Step 2: Open Insights → Customer Service
Select a date range and one or more agents to compare average first response time, average resolution time, resolved conversations, and customer wait time.

For deeper analysis, Insights → Human Agents provides median first-human-response time, positive rating rate, working-hours distribution, and concurrent conversation workload.

Step 3: Review Results in Context
Compare agents handling similar issues and channels. A lower resolution count may reflect complex cases rather than poor performance. Also, conversations involving multiple agents can appear in more than one agent's totals.
Use a 1-on-1 Agent Performance Review Template
Use monthly one-on-one reviews to discuss performance trends for identifying obstacles and agreeing on improvements. Compare related customer service metrics rather than evaluating agents on speed or resolution counts alone.
| Review area | Example observation | Coaching discussion |
|---|---|---|
| Response speed + CSAT | FRT increased, but satisfaction remained stable | Is workload or case complexity affecting response times? |
| Resolved cases + reopen rate | Resolution volume increased alongside repeat contacts | Are conversations being resolved before issues are fully addressed? |
| Availability + workload | Busy duration increased while unhandled conversations accumulated | Does the agent need better workload distribution or additional support? |
| Action plan | Follow-up delays were identified | Improve response guidance and review progress at the next meeting |
End each review with one measurable improvement goal with a clear action and a follow-up date. This keeps performance discussions focused on coaching and avoids simply ranking agents.
Part 4: Metrics for AI + Human Support Teams
When AI handles the first customer message, traditional support metrics don't tell the whole story. A fast response may come from a chatbot, while a resolved conversation may still leave the customer unsatisfied.
So, when it comes to measuring AI customer service metrics accurately, teams need to track AI activity and human hand-offs, along with resolution quality together.
Five AI Customer Service Metrics to Track
| Metric | What it measures | How to interpret it |
|---|---|---|
| AI hand-off rate | Percentage of conversations taken over by human agents | High rates may indicate knowledge gaps or complex requests. Low rates may hide customer abandonment |
| AI-only resolution share | Percentage of eligible resolved issues handled without human assistance | Higher is useful only when resolutions are verified, and customers don't return with the same problem |
| AI reply volume | Number of messages generated by AI agents | Shows AI activity, not successful issue resolution |
| Resolution confidence | AI's assessment of whether a resolved conversation actually addressed the issue | Low confidence calls for review, even if the conversation is marked Resolved |
| First-contact resolution (FCR) recognition | AI evaluation of whether an issue was resolved during the initial consultation | Helps identify effective first-contact support, but needs follow-up validation |
How to Interpret AI Hand-off Rate
AI hand-off rate = Conversations taken over by humans ÷ Total conversations × 100
A rising hand-off rate might indicate that customers need answers beyond the AI's knowledge base. However, it can also mean the system is correctly escalating complicated or sensitive issues.

A very low hand-off rate isn't automatically a success. Customers might abandon conversations when the AI cannot help. Compare hand-offs with satisfaction ratings, along with unresolved cases and repeat contacts, before deciding whether automation is working.
How to Track AI and Human Performance in LiveDesk
EngageLab LiveDesk provides a practical workflow for monitoring chatbot metrics and human involvement.
Step 1: Review AI hand-offs
Open LiveDesk → Overview → AI Agent to view Hand-off, Hand-off Rate, AI-Active, Unhandled, and In Progress conversations.

AI-Active represents conversations currently assigned to AI processing. Unhandled identifies conversations without an AI reply. In progress identifies those with at least one AI reply. These counts help distinguish active AI workloads from conversations awaiting responses.
Step 2: Compare AI and human reply activity
In Overview → New Conversations , review AI Agent reply messages alongside Human Agent reply messages.

For trends over a selected reporting period, use Insights → Efficiency , which compares AI and human message volumes and response speeds.
Increasing AI replies indicate more automated activity, but they don't prove that more issues have been resolved.
Step 3: Evaluate AI-only resolutions
A useful custom KPI is:
AI-only resolution share = Verified issues resolved without human participation ÷ Total eligible resolved issues × 100
Use Insights → Report Center to examine conversation details, resolution methods, message histories, and more. Confirm that no human agent participated and that the issue was genuinely resolved.

However, note that conversation status alone is insufficient because human agents can participate while AI is handling a conversation.
Use Advanced AI Recognition to Check Resolution Quality
LiveDesk AI Capabilities also includes three advanced capabilities, which are disabled by default:
-
Resolution Confidence: Evaluates whether conversations marked Resolved actually addressed the customer's issue.
-
FCR Recognition: Uses a 24-hour evaluation process for conversations resolved during the first consultation.
-
Auto-Inferred Resolution Recognition: Checks customer messages for confirmation when the system automatically infers that an issue was resolved.
Resolution Confidence, FCR Recognition, and Auto-Inferred Resolution Recognition sit in LiveDesk AI recognition. Business and Enterprise include that recognition; Start does not. Enabling a switch spends LiveDesk AI credits and does not change the plan.
Overall, reviewing hand-offs, along with AI activity and verified resolution outcomes, together lets the support teams identify where automation works and where human assistance remains essential.
See your AI hand-off rate in LiveDesk and explore how AI and human support performance can be measured together.
Part 5: How to Set Customer Service KPI Targets Without Fake Benchmarks
The team shouldn't expect the first response time that works for email to work the same for live chat, as it can either be slow or fast. Similarly, a technical support team handling complex issues cannot reasonably follow the same resolution targets as a team answering simple order inquiries.
That's why customer service KPI targets should start with your team's actual performance rather than generic industry averages. Use this four-step approach to set realistic and measurable goals.
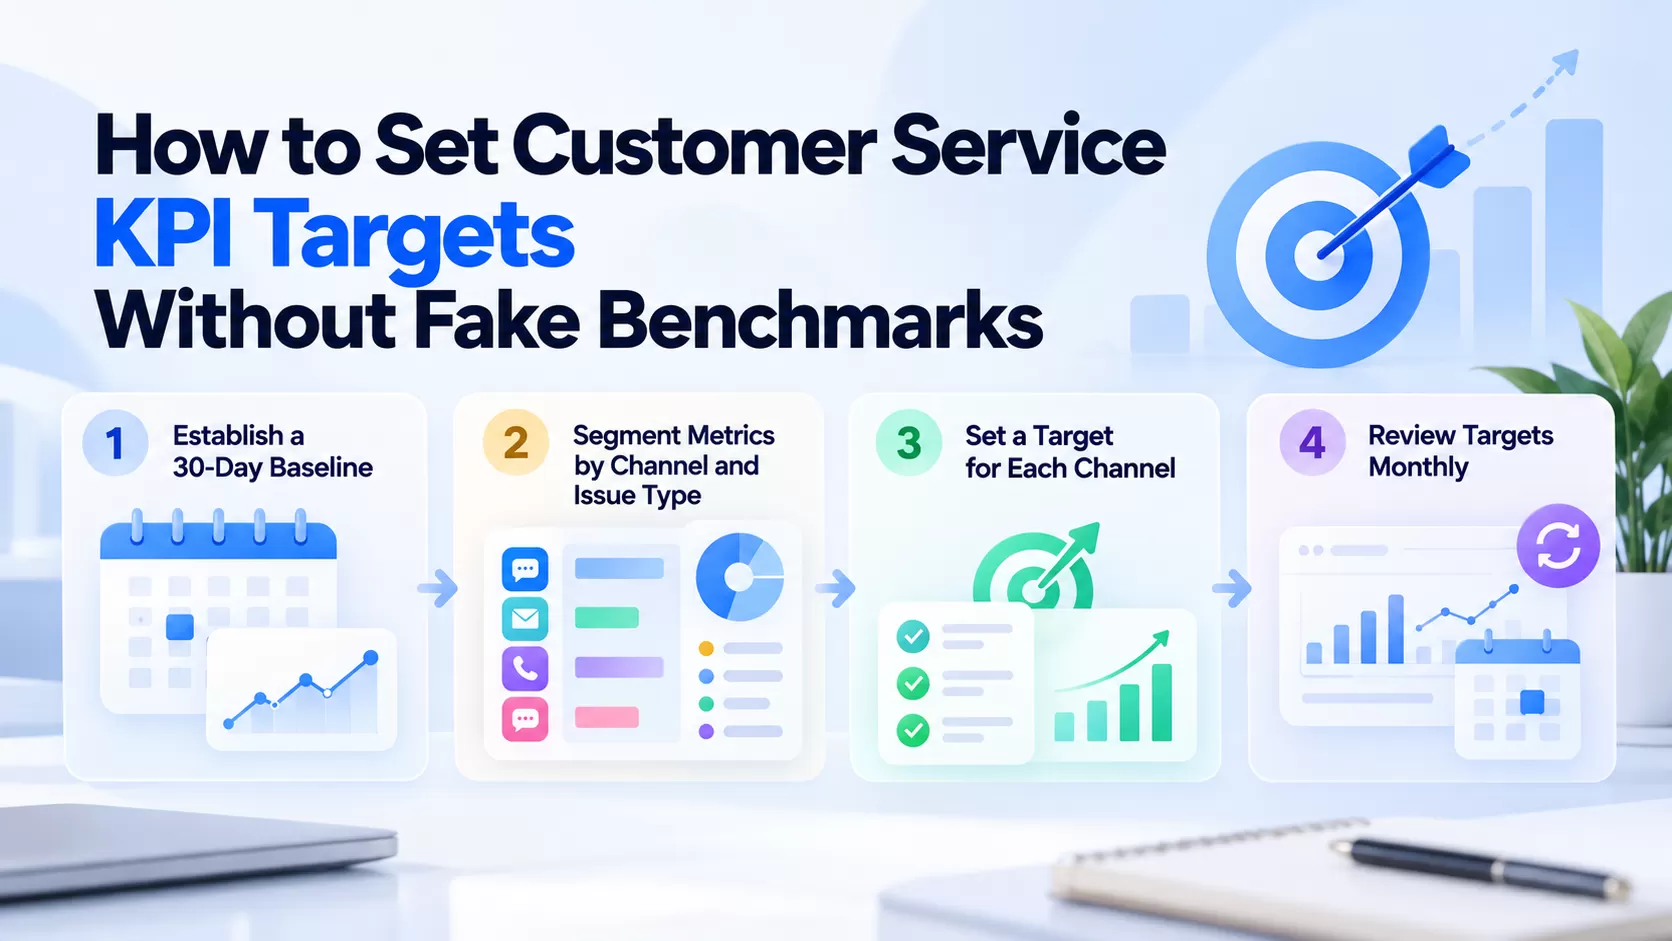
Step 1: Establish a 30-Day Baseline
Collect at least 30 days of support data, including first response time, resolution time, CSAT, conversation volume, and unresolved backlog.
Record the measurement period and calculation method consistently. A full month provides a starting point for identifying patterns, although seasonal fluctuations or low conversation volumes may require a longer comparison period.
Step 2: Segment Metrics by Channel and Issue Type
Avoid combining every conversation into one average. Compare chat, email, and other messaging channels separately, then use issue labels to distinguish support topics, such as billing questions, technical problems, etc.
In LiveDesk, open Insights → Channel to compare response and resolution times across channels.

Use Insights → Labels to identify issue types that require more attention. Both reports support date-range selection.

Note: Conversations can have multiple labels, so combining label totals may double-count individual conversations.
Step 3: Set a Target for Each Channel
Choose an achievable improvement based on the baseline and assign someone responsible for reaching it.
For example, if web chat averages a four-minute first response, a modest reduction may be more realistic than adopting an arbitrary industry target. Identify the operational change needed, such as improving peak-hour staffing or updating response guidance.
Keep targets channel-specific and pair speed improvements with quality indicators such as CSAT.
Step 4: Review Targets Monthly
Compare actual performance with the previous month's baseline and investigate significant changes.
If response times improve but satisfaction declines, determine whether agents are rushing replies. If resolution times increase, examine issue complexity, staffing, or repeated hand-offs before changing the target.
Adjust goals based on evidence to avoid simply raising expectations each month.
Customer Service KPI Target Worksheet
Use this worksheet to turn support data into measurable improvements.
| Metric and segment | Current | Target | Owner | Improvement lever |
|---|---|---|---|---|
| Web chat FRT | 4m 20s | Under 4m | Support lead | Improve peak-hour coverage |
| Email CSAT | 81% | 84% | Quality lead | Improve refund response guidance |
| Billing resolution time | 18 hours | Under 17 hours | Operations lead | Reduce unnecessary hand-offs |
| AI hand-off rate | 34% | Review by issue type | AI support lead | Audit escalation reasons |
\*All values are illustrative examples, not industry benchmarks or actual customer results.
The most useful help desk benchmarks are those measured consistently against your own operations and customer service metrics. Track progress by channel and connect every target to an operational change. Revise goals when the data justifies it.
Part 6: Build a Customer Service Metrics Dashboard in LiveDesk
It becomes difficult to identify problems when the team is tracking customer service KPIs across separate spreadsheets. A useful customer service metrics dashboard should show current workloads, response and resolution trends, customer satisfaction, and the issues causing delays.
EngageLab LiveDesk brings these measurements together through Overview for live operational monitoring and Insights for historical analysis. The following is a step-by-step workflow for building a customer service dashboard in LiveDesk.
Step 1: Check Current Performance in Overview
Open your LiveDesk project and select Overview .
Start with these panels:
-
Active Conversations: Monitor current conversation activity and monthly trends.

-
Human Agent: Check Open, Unassigned, Unhandled, In progress, and Snoozed conversations.

-
Conversation Traffic: Identify conversation volume across 24-hour time windows.

-
Agent Work Analysis: Compare resolved conversations, positive rating rates, online duration, busy duration, and team workload.

-
AI Agent: Review AI-active conversations, replies, and human hand-offs.

These panels help support leads identify immediate workload or staffing concerns before examining historical performance.
Step 2: Find Each KPI in LiveDesk Insights
Go to Insights and select the report that matches the customer service metric you want to investigate.
| Metric to track | LiveDesk report | What to review |
|---|---|---|
| First response time and customer wait time | Conversations | Average response time, waiting time, and trends |
| Average resolution time | Conversations | Resolution duration and resolved conversation count |
| CSAT and survey response rate | CSAT | Satisfaction score, total responses, and customer feedback |
| Conversation volume by channel | Channel | Channel-specific volume, response time, and resolutions |
| Agent productivity | Customer Service (Agents) | Resolved conversations, FRT, resolution time, and customer wait time |
| Positive rating rate and availability | Overview → Agent Work Analysis | Ratings, online/busy duration, and open/unhandled workload |
| Team performance | Teams | Conversation volume, response speed, and resolution efficiency |
| Performance by issue type | Labels | Conversation counts and resolution times for specific topics |
| Unresolved backlog | Report Center | Daily unresolved counts and conversation status details |
| AI hand-off rate and reply volume | Overview → AI Agent / New Conversations | Hand-off rate, AI-active counts, and AI reply messages |
| First contact resolution and AI-only resolution share | Custom analysis using Report Center | Conversation records and validated resolution outcomes |
Note: First contact resolution, AI-only resolution share, and per-agent reopen rate require additional calculations or verification; they are not established as standard built-in KPI percentages.
Step 3: Compare Channels, Agents, and Issue Types
Select a consistent reporting period in Insights , then narrow the analysis:
-
Insights → Channel : Compare response and resolution times across chat, email, and other messaging channels.
-
Insights → Customer Service: Select agents to review their conversation volumes and handling efficiency.
-
Insights → Teams : Identify differences in workload and resolution performance across support teams.

-
Insights → Labels : Find recurring issues associated with longer resolution times.

-
Insights → CSAT : Filter feedback by time, agent, channel, team, or rating to investigate customer dissatisfaction.

If you want deeper response-time analysis, Insights → Efficiency provides median response and resolution times, peak-hour traffic patterns, and AI-versus-human reply comparisons.

LiveDesk's Question Classification AI can also apply topic labels to conversations when the recognition capability is configured and enabled. These labels support further analysis of frequently reported issues.
Question Classification is part of that same AI recognition: included on Business and Enterprise, not on Start, and billed in LiveDesk AI credits.
Step 4: Set Up a Default View for Support Leads
The team doesn't have to monitor every available statistic. Use this recommended customer service dashboard review order:
| Review frequency | Priority metrics | Where to check |
|---|---|---|
| Start of each shift | Open, unassigned, and unhandled conversations | Overview → Human Agent |
| During the day | Conversation traffic, agent availability, and AI hand-offs | Overview → Conversation Traffic / Agent Work Analysis / AI Agent |
| Weekly | FRT, resolution time, CSAT, and channel volume | Insights → Conversations / CSAT / Channel |
| Monthly | Agent and team performance, issue trends, and unresolved backlog | Insights → Customer Service / Teams / Labels / Report Center |
This provides a repeatable management view without overwhelming the team with unnecessary KPIs. However, it is just a recommended review workflow. It is not a claim that all these metrics appear in one configurable LiveDesk screen.
Step 5: Create Reports for Detailed Analysis
When an issue needs closer investigation, open Insights → Report Center .

Choose an existing report template or create a custom report. Select a data scope such as Conversation Details, Daily Conversation Aggregation, or Daily Agent Aggregation, then choose the relevant fields.

Apply date and channel filters, inspect individual conversation records, and export eligible results as CSV or XLSX for further analysis.
For example, if first response time increases, compare channel volumes and hourly traffic before adjusting staffing. If CSAT declines, filter low-rated feedback and investigate the associated conversations.
LiveDesk's real-time Overview data and selectable reporting periods in Insight Analytics help support teams connect daily service activity with longer-term performance trends.
Start free with LiveDesk . New users receive a 30-day free plan with up to 1,000 conversations and 100 AI credits.
Part 7: What to Do When a Customer Service Metric Moves
A rising response time or falling satisfaction score tells you something has changed, but not why. Before adjusting targets or evaluating agents, investigate the conversations and channels/workflows behind the number.
Use this diagnostic playbook to improve customer service metrics by connecting each warning sign to a likely cause and a practical next step.
Customer Service KPI Diagnostic Playbook
| Warning sign | Possible cause | Where to check in LiveDesk | Recommended fix |
|---|---|---|---|
| First response time rises | Peak-hour traffic exceeds available staffing | Overview → Conversation Traffic and Insights → Human Agents | Compare hourly demand with agent availability and adjust shift coverage |
| CSAT drops | Incomplete answers, or recurring complaints | Insights → CSAT and Labels | Review low-rated conversations and identify recurring issue labels, along with improving response guidance |
| AI hand-off rate increases | Missing knowledge, complex inquiries, or appropriate escalations | Overview → AI Agent and Report Center | Audit transferred conversations, address knowledge gaps, and refine AI fallback paths |
| Resolution time increases | Repeated transfers or complex issues | Insights → Efficiency and Labels | Identify slow issue categories and improve routing with Rule Agent Flows |
| Unhandled conversations increase | Assignment gaps or insufficient available agents | Overview → Human Agent | Review unassigned conversations and configure appropriate agent assignment rules |
| Customer wait time increases | Delayed follow-ups or conversations left unattended | Insights → Conversations and Report Center | Identify stalled conversations and configure timed follow-up or escalation Flows |
Note: These causes are just diagnostic possibilities. Confirm them by reviewing the relevant conversation data before making changes.
Turn Findings Into Action With LiveDesk Rule Agent
When the problem involves escalation or delayed follow-ups, LiveDesk's Rule Agent can automate parts of the correction.
For example, if billing conversations take longer because they reach the wrong team:
-
Create a flow: Start from a blank Flow or an available template in Rule Agent.
-
Set the trigger: Choose an event such as conversation creation, then specify the relevant channel and audience.
-
Add routing conditions: Use a Conditional Branch to identify the applicable issue label, source, or customer attributes.
-
Assign the conversation: Add an Assign Agent action to route matching requests to an eligible agent or team.
-
Test and activate: Verify normal, failure, timeout, and no-action paths before enabling the Flow.

Agent assignments must follow the target channel's configured assignment scope. For AI-related issues, Rule Agent also supports fallback workflows that transfer conversations to human support when AI handling fails.
Check Whether the Fix Worked
After making a change, compare the affected metric using the same channel with the same issue type and reporting period wherever possible.
For example, if routing changes reduce resolution time, confirm that CSAT and repeat-contact outcomes have not worsened. If staffing adjustments improve first response time, check whether customer wait time has also decreased.
The purpose of monitoring help desk performance is beyond just improving a dashboard number. It's to identify the cause of a service problem, while making a targeted change and verifying that customers receive better support.
Part 8: Track Fewer Metrics, Act on Them Faster
Improving customer service metrics doesn't require tracking every available KPI. Start with 5-7 metrics covering speed, resolution, quality, and workload. Pair related measures to avoid misleading conclusions, then establish a 30-day baseline for each support channel.
Review results monthly and use the diagnostic playbook to investigate changes before adjusting staffing or workflows. This creates a repeatable process, i.e., measure, investigate, improve, and review.
LiveDesk helps teams monitor these metrics through its comprehensive reporting dashboard and conversation insights. So, start free with LiveDesk with a 30-day plan that includes 1,000 conversations and 100 AI credits.
Part 9: FAQs About Customer Service Metrics
1. What are the five key customer service KPIs?
Five essential customer service KPIs are first response time (FRT), average resolution time, first contact resolution (FCR), customer satisfaction (CSAT), and unresolved backlog. Together, they measure response speed, resolution efficiency, service quality, and outstanding workload. Teams can also track conversation volume and AI hand-off rates when relevant.
2. What is a good first response time for customer service?
A good first response time depends on the support channel, along with issue urgency and customer expectations. Live chat usually requires faster replies than email, so applying one benchmark across both channels can be misleading. Instead, measure your current response times over 30 days and establish channel-specific targets. Monitor CSAT alongside speed to ensure faster replies deliver meaningful assistance.
3. How do you calculate first contact resolution?
First contact resolution (FCR) measures the percentage of customer issues resolved during the initial interaction without requiring further contact.
FCR (%) = (Issues resolved on first contact ÷ Total eligible issues) × 100
For example, resolving 80 of 100 eligible issues on first contact produces an 80% FCR rate. Define a consistent follow-up window and account for reopened conversations to avoid overstating performance.
4. What is the difference between customer service metrics and KPIs?
Customer service metrics are measurements used to monitor support activities, such as messages received, conversation volume, or response times. Key performance indicators (KPIs) are selected metrics tied to specific business objectives. For example, first response time becomes a KPI when the goal is to reduce customer waiting times. Every KPI should have a defined target, with an accountable owner and a regular review process.