Overview
On the Overview page, you can view the app's key operational metrics, including message volume, active users, new users, users who turned off notifications, user distribution, push conversion, notification permissions, and the distribution of push channels and device brands.
Key Metrics
Updated daily
- Message Volume: As of yesterday, the total number of messages sent by the app (msgID count).
- Active Users: As of yesterday, the total number of users who have opened the app at least once.
- New Users: As of yesterday, users who opened the app for the first time and successfully registered for EngageLab services.
- Users Who Turned Off Notifications: As of yesterday, the total number of users who have turned off notification permissions for the app.

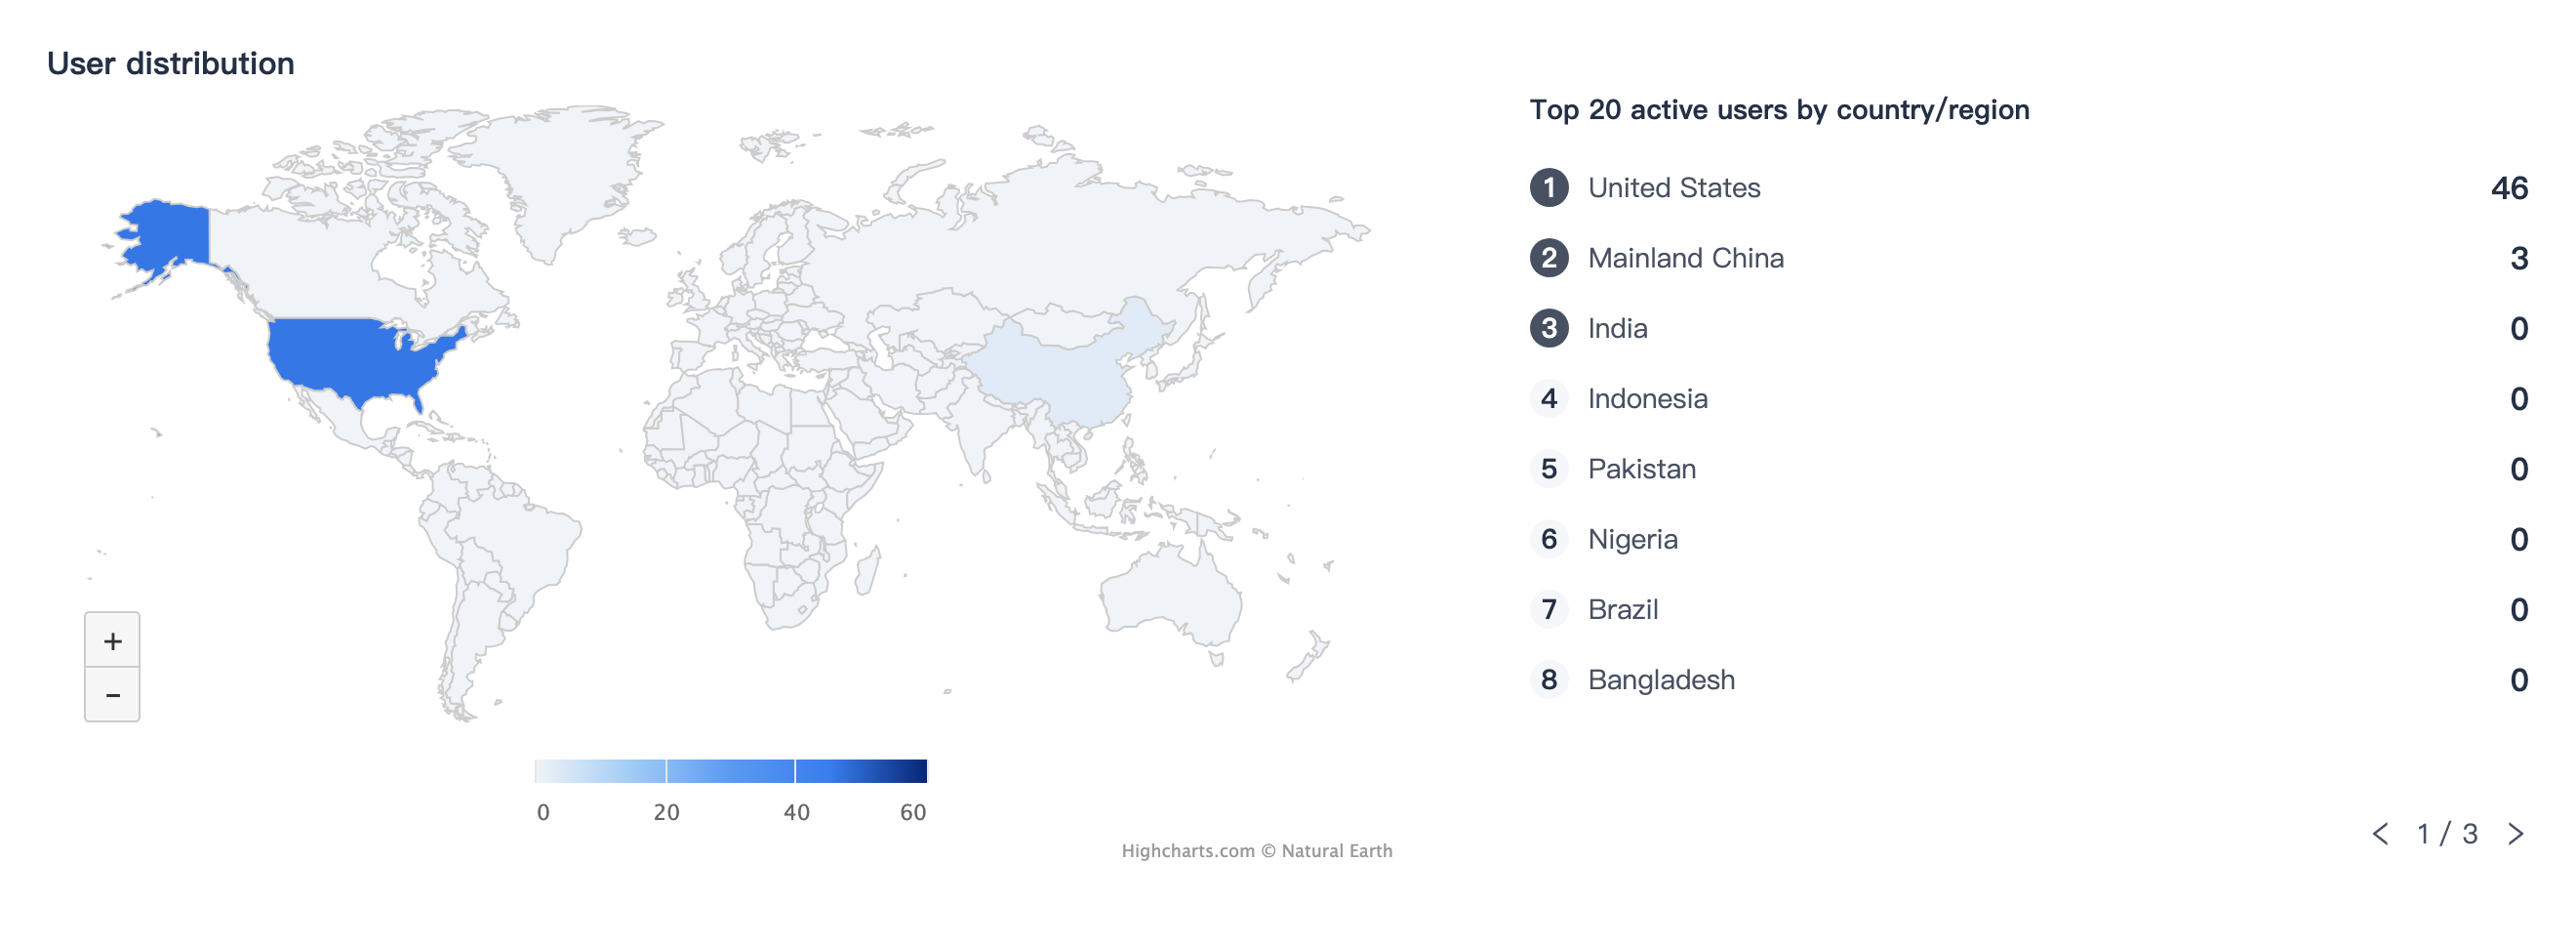
User Distribution
Updated monthly
Shows the TOP 20 countries/regions by active users for the current app, helping you identify where your main users are located.
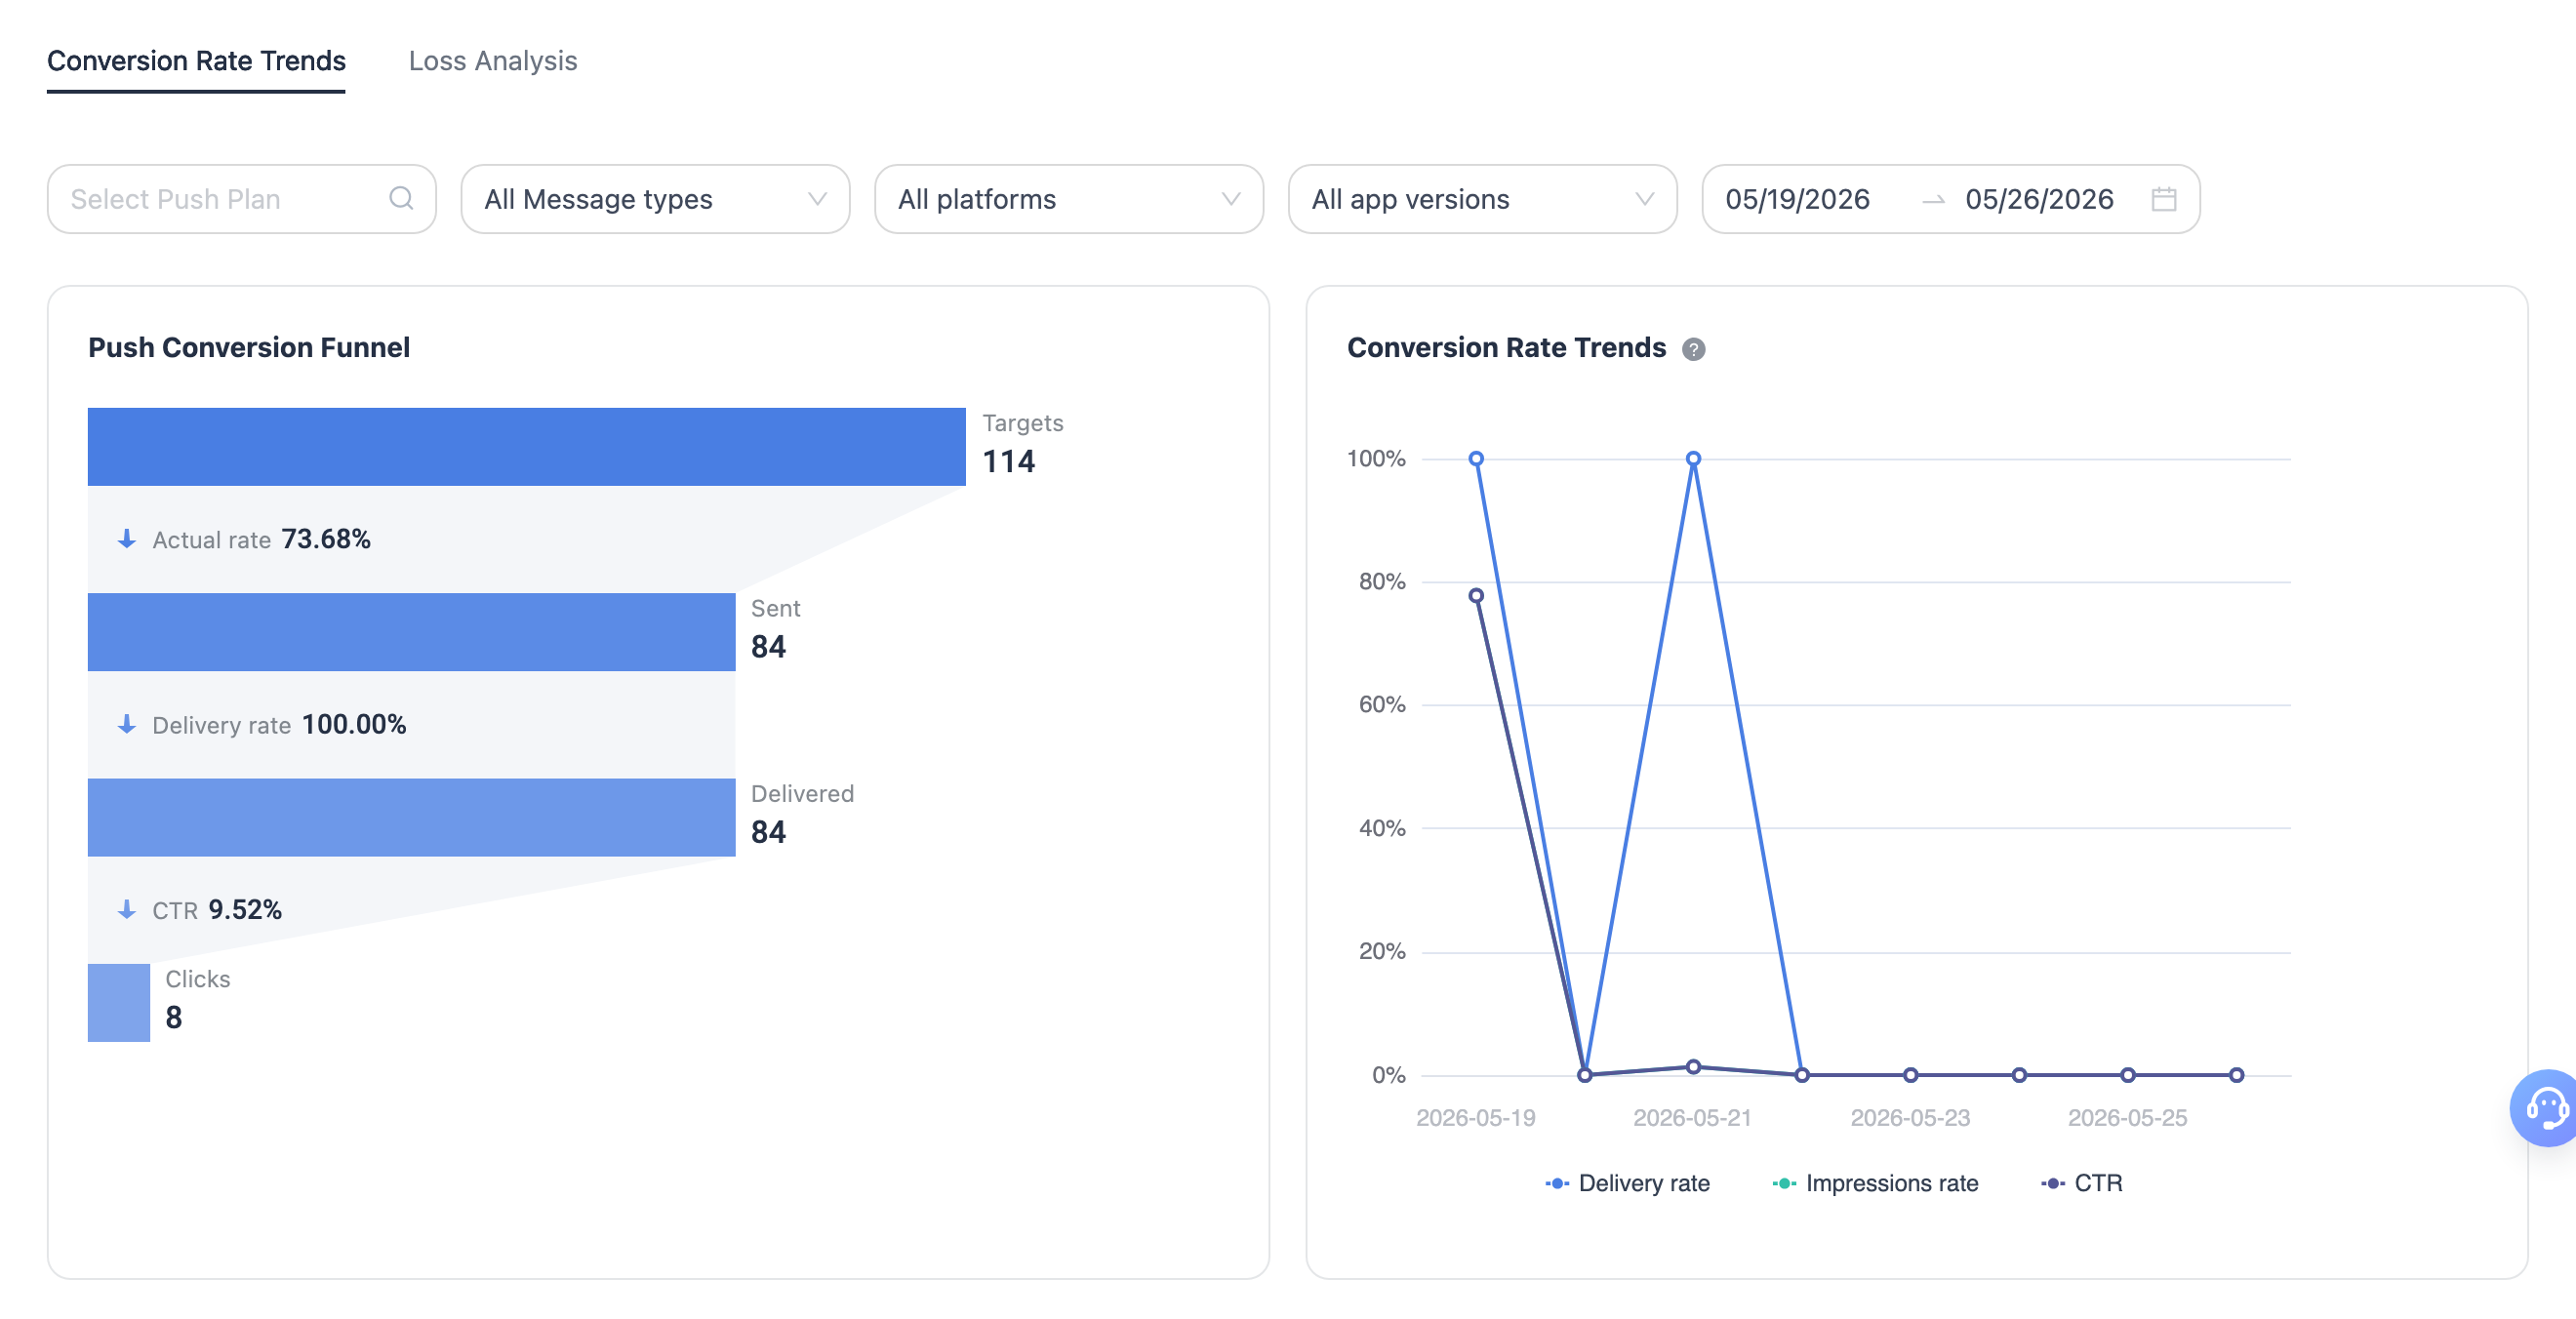
Push Conversion
Updated daily
The Push Conversion module shows the overall conversion funnel and conversion trends for your app, helping you evaluate performance across sending, delivery, display, and click stages, and analyze drop-off reasons.
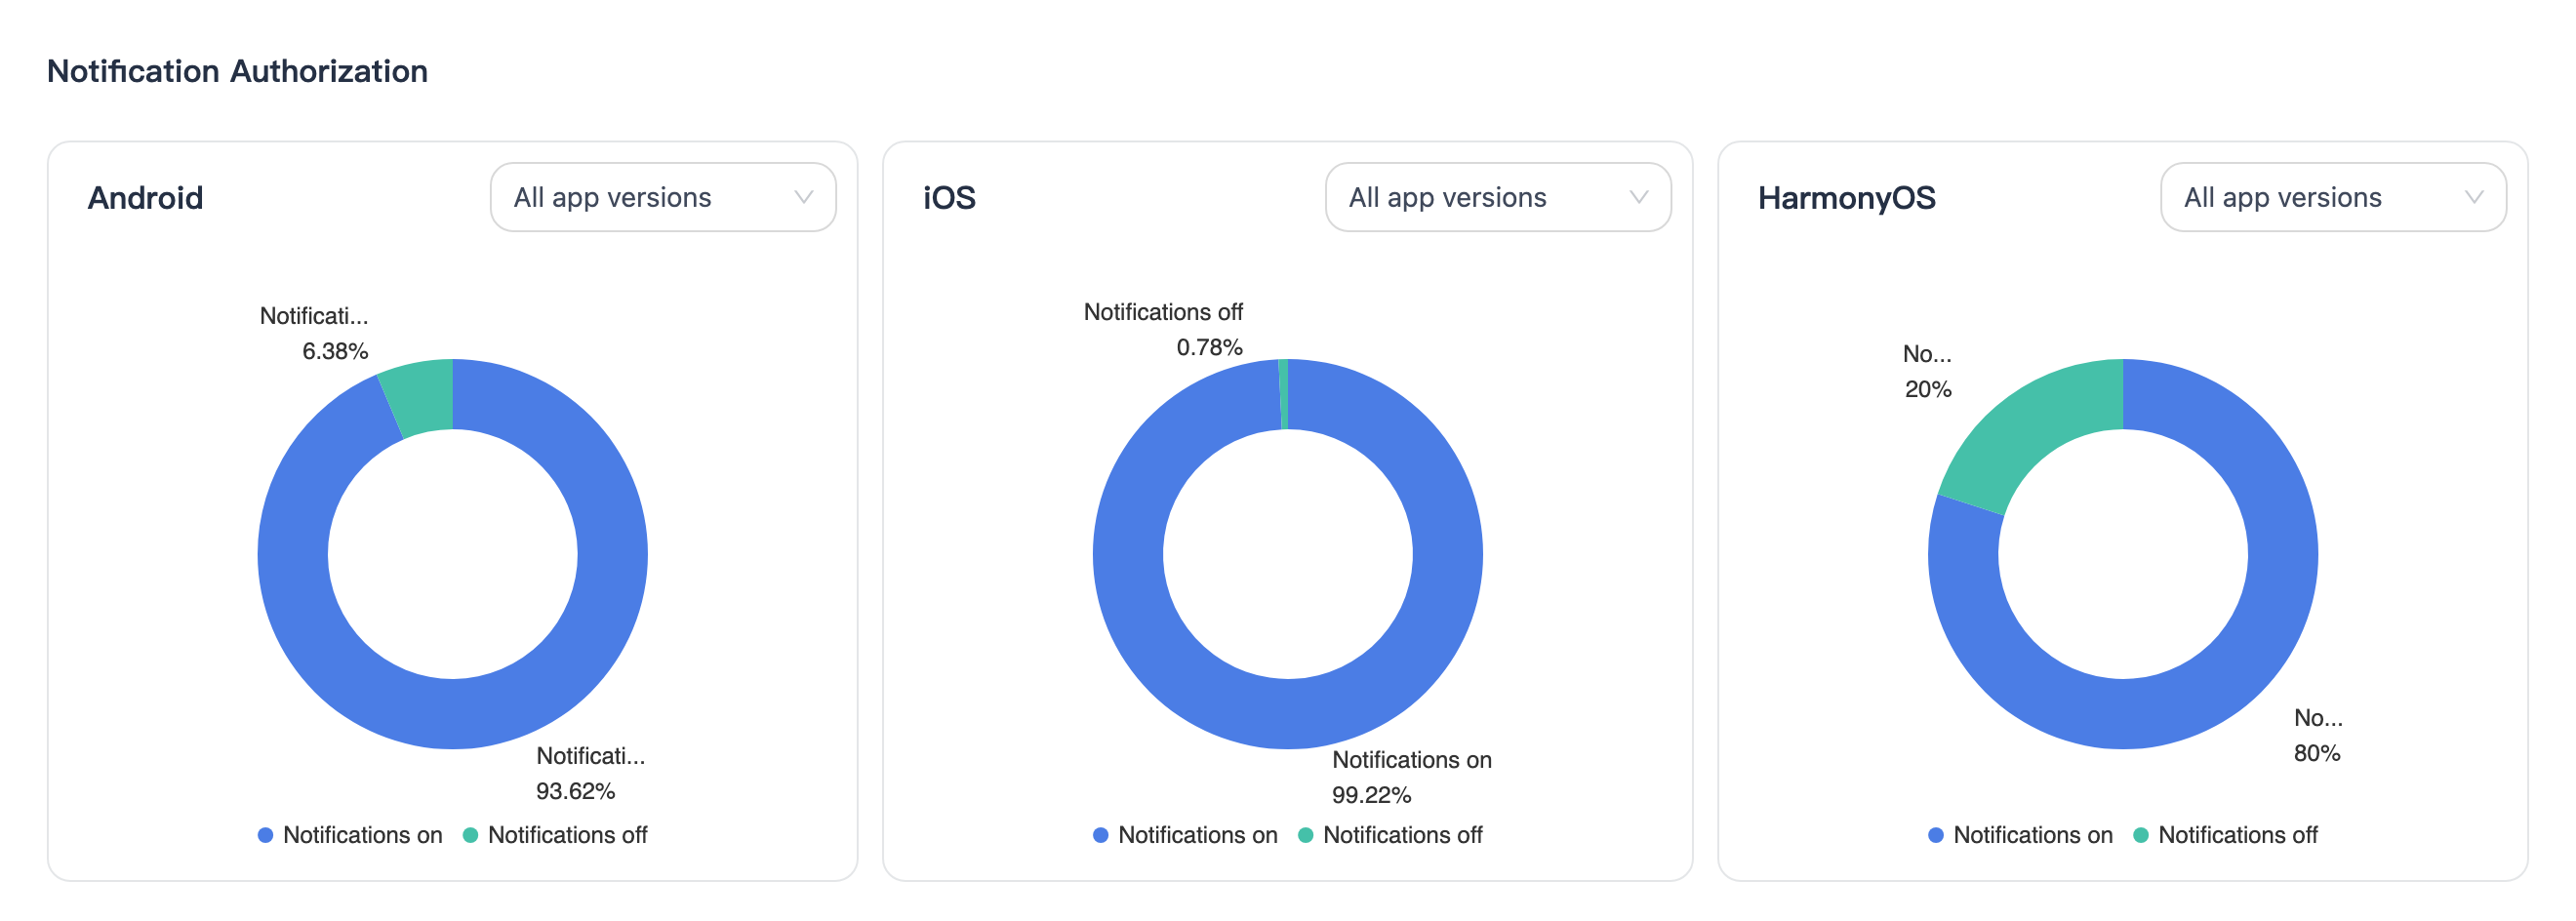
Notification Permissions
Updated daily
View notification permission status by Android, iOS, and HarmonyOS to assess the size of users reachable through system channels.
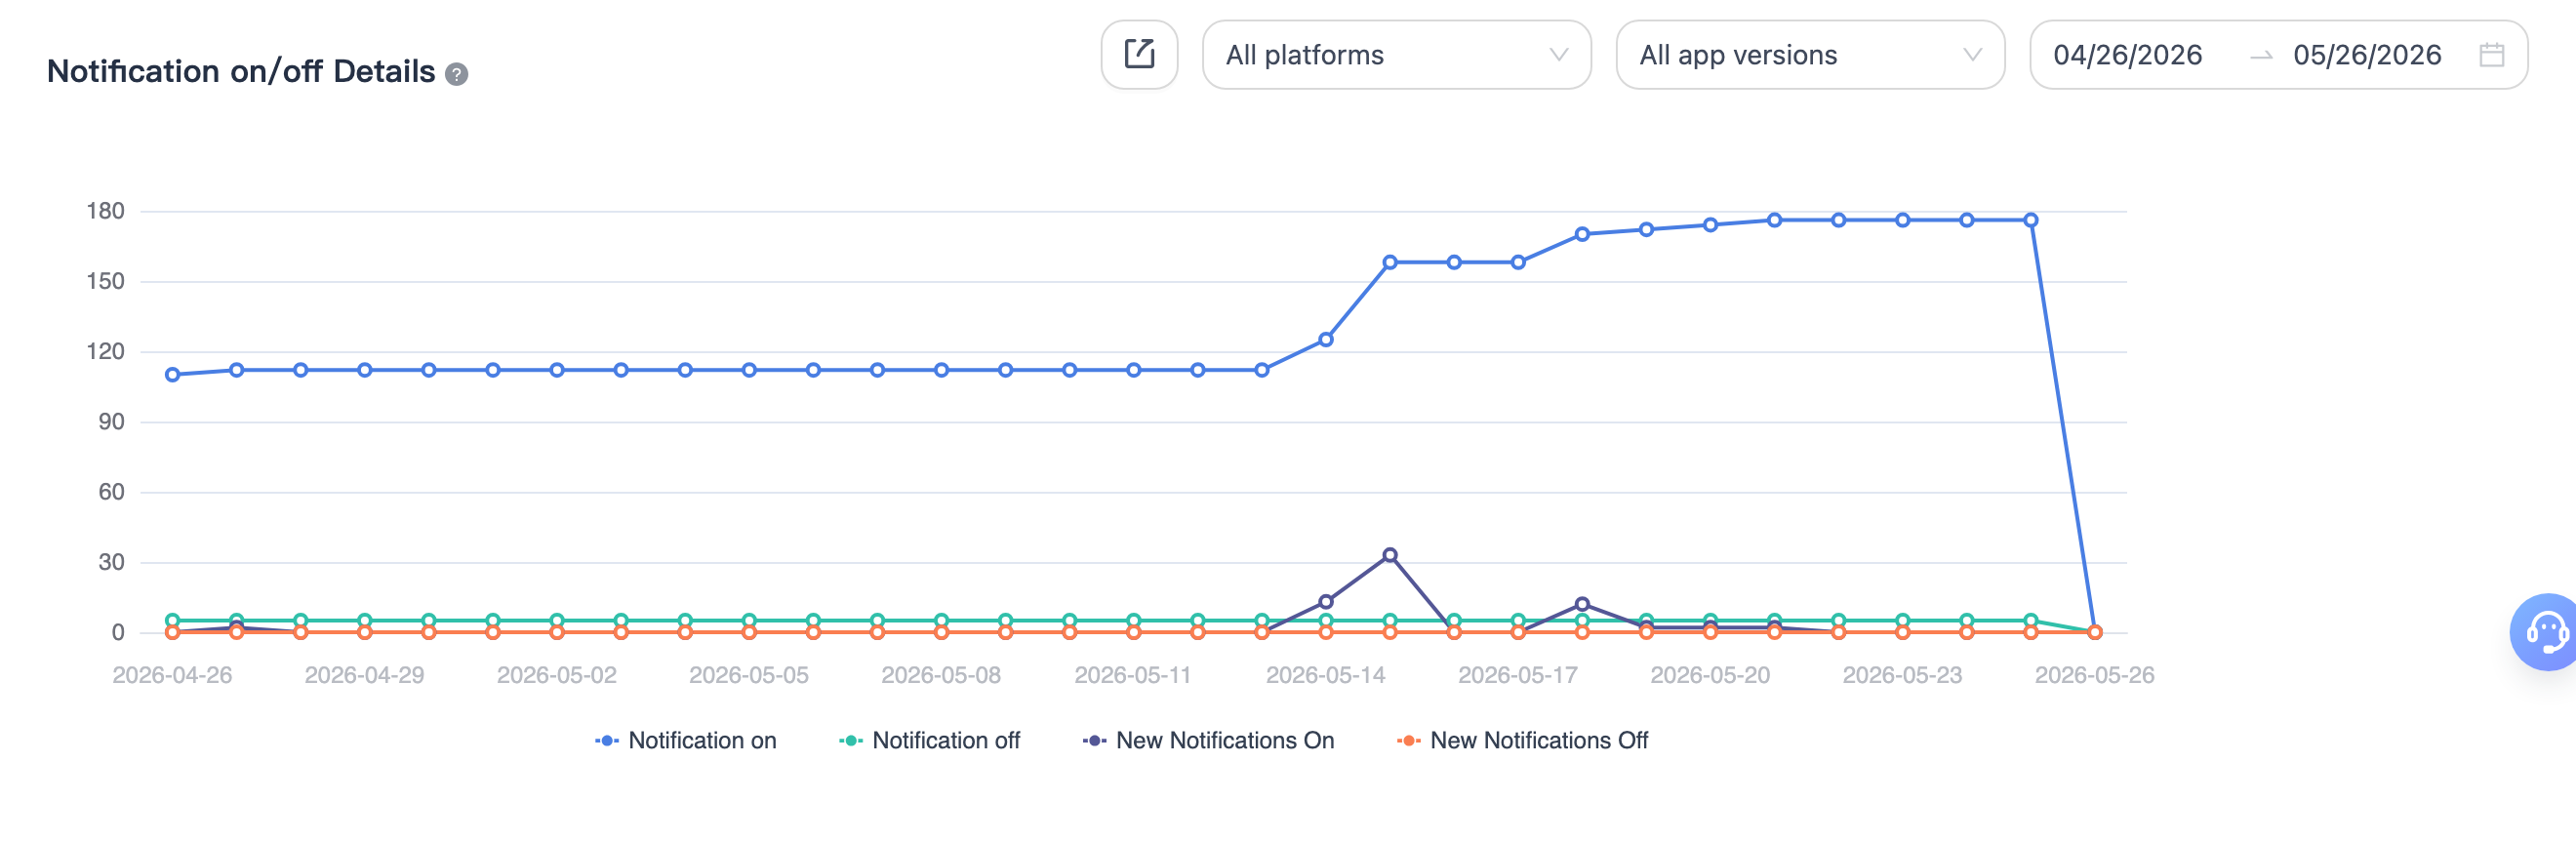
Notification Permission Details
Updated daily
Shows the trend in the number of users who have enabled or disabled notification permissions, making it easier to track authorization status over time.
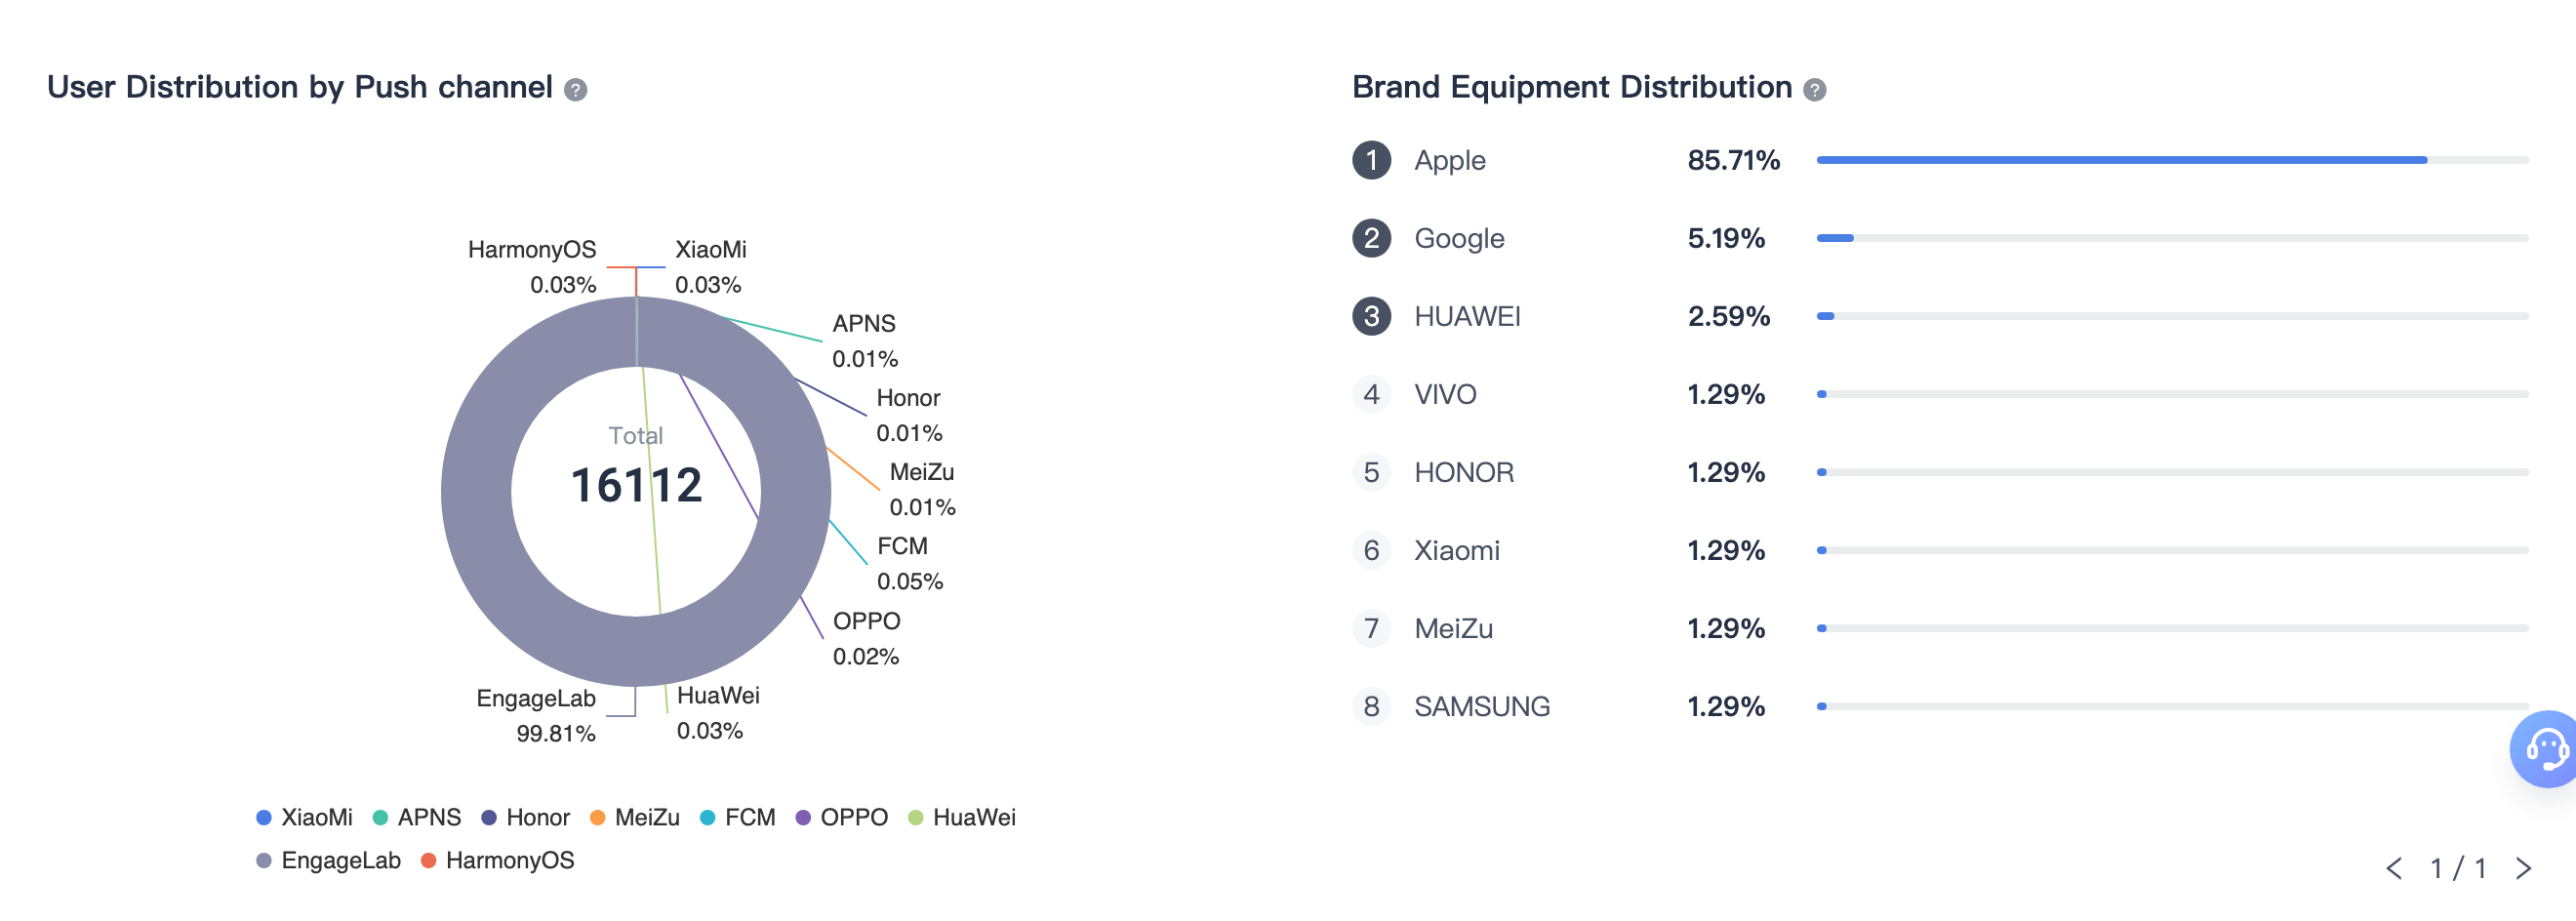
Push Channel and Device Brand Distribution
Updated daily
- Push Channel User Distribution: Shows the distribution of all registered users in the current app across different push channels. In some cases, one user may have multiple channel identifiers (tokens) and may therefore be counted more than once.
- Device Brand Distribution: Shows the device brand distribution of all registered users in the current app.