Jacob Morrow
Updated: 2026-05-21
Most SMS systems aren't broken—they're designed for average traffic. When the World Cup kicks in, that 500-2,300% traffic spike exposes the gaps between "operational" and "reliable." Here's what actually fails and how to prepare.
Executive Summary
During peak events like the World Cup, SMS delivery failures increase dramatically due to queue overflows, carrier filtering, DLR latency, and route instability. Industry data shows SMS traffic spikes of up to 2,337% during major matches. A Princeton/NEC study found baseline SMS delivery failure rates of 5.1% during normal operations—peak events compound these issues significantly. This guide examines 7 critical failure patterns and provides a comprehensive peak-readiness checklist for enterprise SMS deployments.
The Four Dimensions of Reliable SMS Under Load
Before diagnosing failures, you need the right metrics. "Delivery rate" alone is insufficient for peak planning. True SMS reliability during high-traffic events requires evaluating four interconnected dimensions:
1. Time-to-Delivery (Percentiles Matter)
Average latency is meaningless. During peak events, you need percentiles:
- p50 (Median): 90% of messages should deliver within 30 seconds
- p95: Acceptable threshold is under 2 minutes for transactional SMS
- p99: Critical for OTP and security messages—should stay under 5 minutes
During World Cup Belgium vs USA (2014), SAP Mobile Services recorded 2,337% traffic increases. Without percentile-based monitoring, average latency can mask severe tail delays affecting 10%+ of your messages.
2. Filtering and Silent Drops
According to Airwide Solutions CMO Jay Seaton: "Dramatic peaks in messaging traffic are becoming more frequent and more pronounced... While increased traffic provides great revenue potential, it also presents the challenges of ensuring that the underlying infrastructure does not become congested."
During traffic spikes, carriers aggressively filter:
- Messages exceeding carrier volume thresholds
- Unregistered sender IDs or templates
- Content matching known spam patterns (even legitimate offers)
- Messages from IPs with degraded sender reputation
3. DLR Quality (Delivery Receipts)
DLRs aren't just confirmations—they're your visibility into silent failures. During peak events:
- DLR latency can exceed 5-10 minutes (vs. <30 seconds normally)
- Some carriers batch DLR processing, masking true delivery times
- Without real-time DLRs, you can't trigger retry logic or alert customers
4. Route Stability by Market
Different markets exhibit different failure characteristics during peak events:
| Market Type | Peak Behavior | Risk Level |
|---|---|---|
| Tier-1 Direct Routes | 10-15% latency increase | Low |
| Tier-2 Aggregator Routes | 30-50% delivery rate drop | Medium |
| Gray Routes | Up to 80% silent failures | High |
| Roaming Traffic | 4:1 outbound/inbound ratio surge | Medium-High |
The 7 Critical Peak-Load SMS Failure Patterns

1 Burst Traffic Overwhelms Queues
When Belgium beat the USA during the 2014 World Cup, Belgian fans sent 2,337% more SMS messages than usual. If your SMS gateway has fixed queue depths, burst traffic causes:
- New messages rejected at the API level (HTTP 503)
- Messages queued indefinitely without timeout handling
- Upstream providers throttling your account
Technical Fix: Implement auto-scaling queue infrastructure with horizontal pod autoscaling (HPA) in Kubernetes or equivalent cloud-native scaling. Set queue depth alerts at 60% capacity and scale proactively.
2 Dashboard Shows "Sent" But Customers Didn't Receive
During normal conditions, SMS delivery failure rates average 5.1% according to Princeton/NEC Labs research. During peak events, this can jump to 15-30% due to carrier filtering—without generating failure notifications.
Known filtering triggers during high-traffic periods:
- Volume exceeding carrier-specific thresholds per minute/hour
- Unrecognized sender IDs (not pre-registered)
- Content flagged by ML-based spam filters
- Destination numbers on carrier blocklists
Technical Fix: Mirror 1% of traffic to a validation endpoint that polls DLR status. Compare mirror results against your send dashboard to detect silent drops.
3 DLRs Too Late to Help
Delivery receipts during peak events can take 5-15 minutes—rendering them useless for:
- OTP validation (60-120 second expiry windows)
- Time-sensitive promotional offers
- Real-time operational notifications
During the 2022 World Cup Final, WhatsApp recorded 25 million messages per second. Even milliseconds of DLR delay compounds at this scale.
Technical Fix: Implement optimistic delivery assumptions with async DLR reconciliation. For time-critical messages, use parallel delivery channels (e.g., WhatsApp + SMS fallback).
4 Route Quality Volatility
Carrier route quality fluctuates during peak events:
- Direct routes may become congested, triggering fallback to Tier-2
- Tier-2 aggregators face their own capacity constraints
- Gray routes become completely unreliable
Research from MACH (which clears 50% of global roaming traffic) documented 150% increases in SMS roaming traffic during the 2010 World Cup, with traffic correlating directly to match schedules.
Technical Fix: Maintain active relationships with multiple Tier-1 carriers per market. Implement real-time route quality scoring with automatic failover logic.
5 Retry Storms
When initial delivery attempts fail, naive retry logic creates cascade effects:
- Retries arriving during peak congestion windows
- Amplified traffic exceeding original burst volume
- Delivery attempts hitting rate-limited endpoints
Technical Fix: Implement exponential backoff with jitter (公式: min(cap, base * 2^attempt + jitter)). Consider retry windows aligned to historical delivery success patterns rather than fixed intervals.
6 Promotional Operations Break at Scale
Marketing teams schedule bulk campaigns around World Cup halftimes and finals. During Germany vs Argentina (2014 World Cup Final), SMS traffic data showed:
- Massive spikes at halftime breaks
- Traffic deltas directly tracking goal-scoring moments
- Post-match "wind-down" period lasting 30-60 minutes
Operational Fix: Schedule promotional SMS during low-risk windows (halftime planning window: 15-45 minutes before matches). Avoid launching campaigns during the 15 minutes following match endpoints.
7 Peak Volume Inflated by Non-Customer Activity
During peak events, your SMS infrastructure serves both customer-facing messages AND:
- Carrier-to-carrier verification messages
- Roaming agreements traffic
- Network management SMS
- OTT fallback messages
This "background noise" can inflate apparent traffic by 20-40%, skewing capacity planning models.
Technical Fix: Implement traffic source tagging and separation. Isolate customer-facing message queues from carrier infrastructure traffic.
Peak Readiness Checklist
Infrastructure
- ✓ Queue depth monitoring: Set alerts at 40%, 60%, 80% capacity thresholds
- ✓ Auto-scaling validated: Load test at 3x, 5x, and 10x normal volume
- ✓ Multi-carrier routing: Active Tier-1 connections in all target markets
- ✓ Geographic redundancy: Failover regions identified and tested
- ✓ API rate limit buffers: 20% headroom above normal utilization
Deliverability
- ✓ Sender ID registration: Pre-registered for all target markets
- ✓ Template pre-approval: Marketing templates validated before peak window
- ✓ Number hygiene: Deduplication and validation completed 48+ hours before
- ✓ Opt-out processing: Real-time handling, no batch processing delays
- ✓ Traffic mirroring enabled: 1% validation sample for silent drop detection
Operations
- ✓ On-call rotation: 24/7 coverage with <15 minute response SLA
- ✓ Runbook documentation: Escalation paths for each failure mode
- ✓ Communication templates: Customer-facing status page updates pre-written
- ✓ Campaign scheduling: Avoid launch during peak congestion windows
- ✓ Stakeholder notifications: Marketing and support teams briefed on expected delays
Tooling That Matches Peak Reality
Generic SMS gateways assume average traffic. During the 2010 World Cup, Aicent recorded 300% traffic surges over baseline weeks, with single-day peaks correlating to match schedules. Your tooling needs to match this reality.
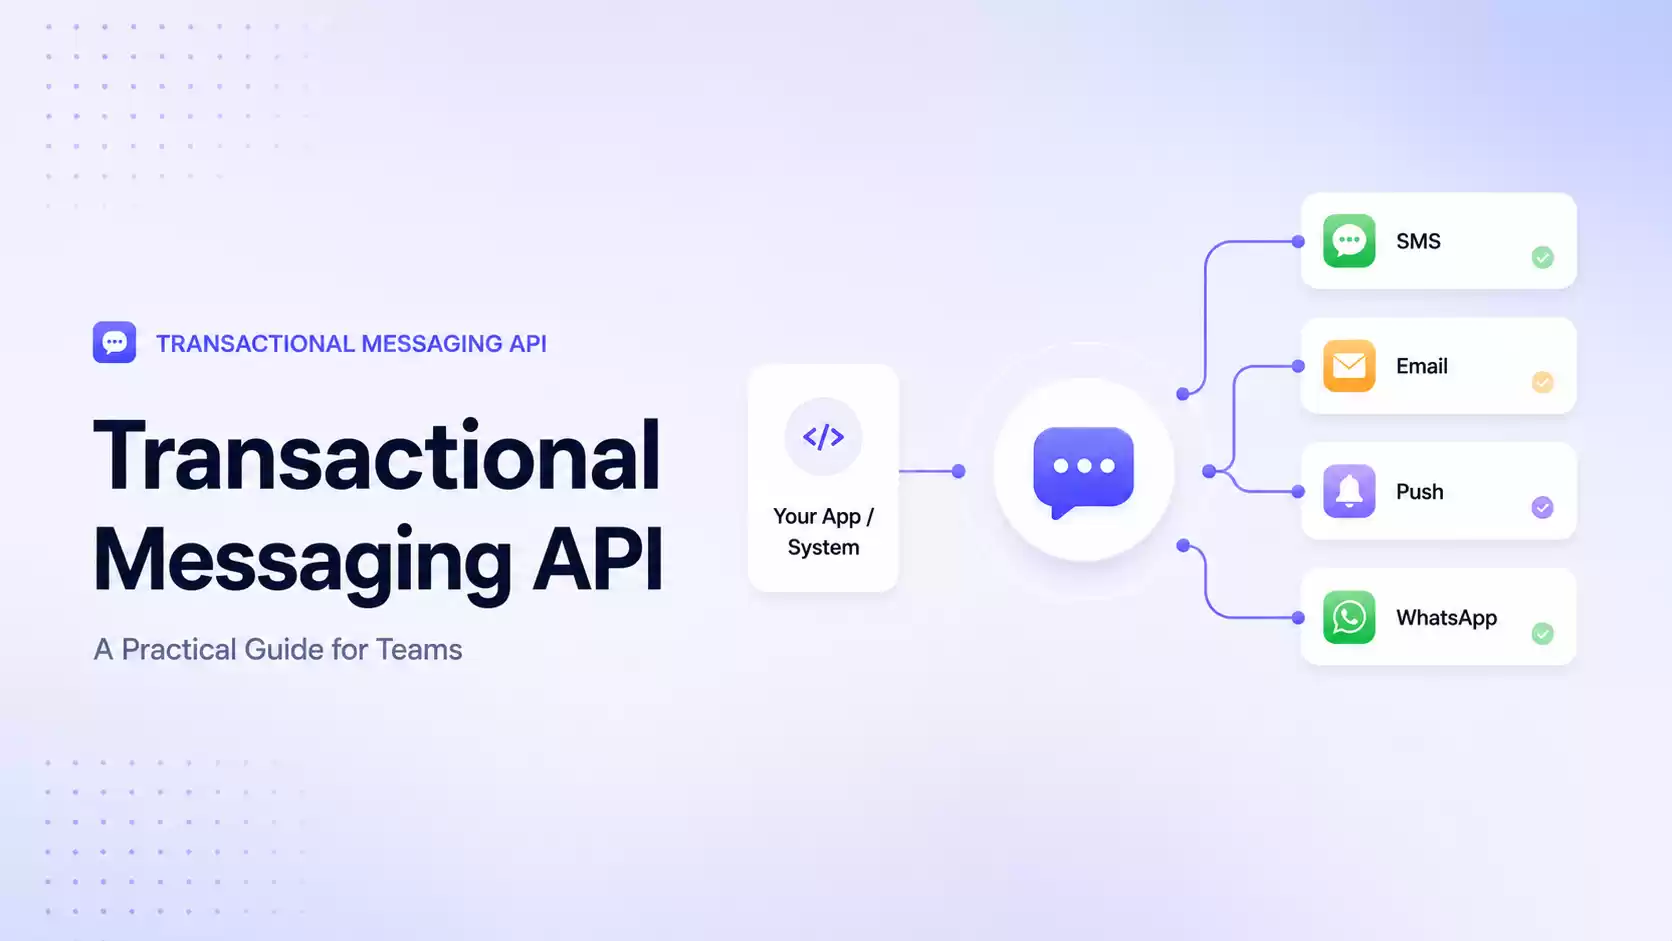
EngageLab SMS is designed for exactly these scenarios:
- Dynamic capacity scaling: Infrastructure that scales horizontally during traffic spikes
- Multi-carrier routing with automatic failover: Direct Tier-1 connections across 190+ countries
- Real-time DLR monitoring: Sub-second delivery receipt processing
- Silent drop detection: Traffic mirroring and reconciliation
- Peak-ready support: Dedicated engineering support for major event campaigns
Learn more about EngageLab SMS infrastructure or schedule a peak-readiness consultation.

Frequently Asked Questions
Why do SMS systems fail during World Cup events?
SMS systems are typically designed for normal traffic patterns. During World Cup events, traffic can spike by 500-2,300%, overwhelming queues, triggering carrier filters, and causing route congestion. A Princeton/NEC study found SMS delivery failure rates as high as 5.1% during normal operations—peak events compound these issues significantly.
What is considered a good SMS delivery rate during peak events?
Under normal conditions, a 95-98% SMS delivery rate is considered healthy. However, during peak events like World Cup matches, failure rates can spike significantly. Enterprise-grade SMS providers with direct carrier connections and dynamic capacity scaling maintain 97%+ delivery even during 10x traffic surges.
How can businesses prepare SMS infrastructure for peak loads?
Peak readiness requires: 1) Horizontal scaling with auto-scaling queues, 2) Direct carrier relationships (Tier-1 routes) for market-specific stability, 3) Real-time DLR monitoring with sub-minute latency, 4) Throttling and retry logic with exponential backoff, 5) Pre-validated templates for each market, and 6) Traffic mirroring to detect silent drops.
What's the difference between SMS 'sent' and 'delivered'?
"Sent" means the SMS was submitted to the carrier or aggregator. "Delivered" (DLR=Delivered Receipt) means the message reached the recipient's device. During peak events, up to 15-30% of messages may be filtered or silently dropped by carriers without triggering failure notifications—meaning your dashboard shows "sent" but customers never receive the message.
How does EngageLab handle SMS peak loads during major events?
EngageLab SMS employs multi-carrier routing with automatic failover, real-time traffic monitoring, and dynamic capacity scaling. Our infrastructure maintains direct Tier-1 carrier connections across 190+ countries, ensuring consistent delivery rates even during 10x traffic spikes. Contact our team for a peak-readiness assessment.
"Dramatic peaks in messaging traffic are becoming more frequent and more pronounced, not only due to the continued increased use of SMS globally but also because of the popularity of text message based services such as social networking, mobile banking and mobile advertising."
Ready to Scale SMS for Peak Events?
Whether you're preparing for the next World Cup or building year-round peak resilience, EngageLab has the infrastructure and expertise to ensure your messages land.