Jacob Morrow
Updated: 2026-06-25
You spent real budget acquiring a customer, but do you actually know what they're worth to your business, or are you just guessing?
The answer matters more than most teams realize. ChartMogul's 2024 SaaS Retention Report found that companies with strong retention grow at twice the speed of their peers. Yet most businesses still calculate Customer Lifetime Value (LTV) with a formula that's either too generic to be useful, or quietly wrong.
This guide gives you the exact LTV formula for both ecommerce and SaaS businesses, the most common calculation mistakes that throw off the number entirely, how to model LTV before you even have retention data, and proven ways to increase it.
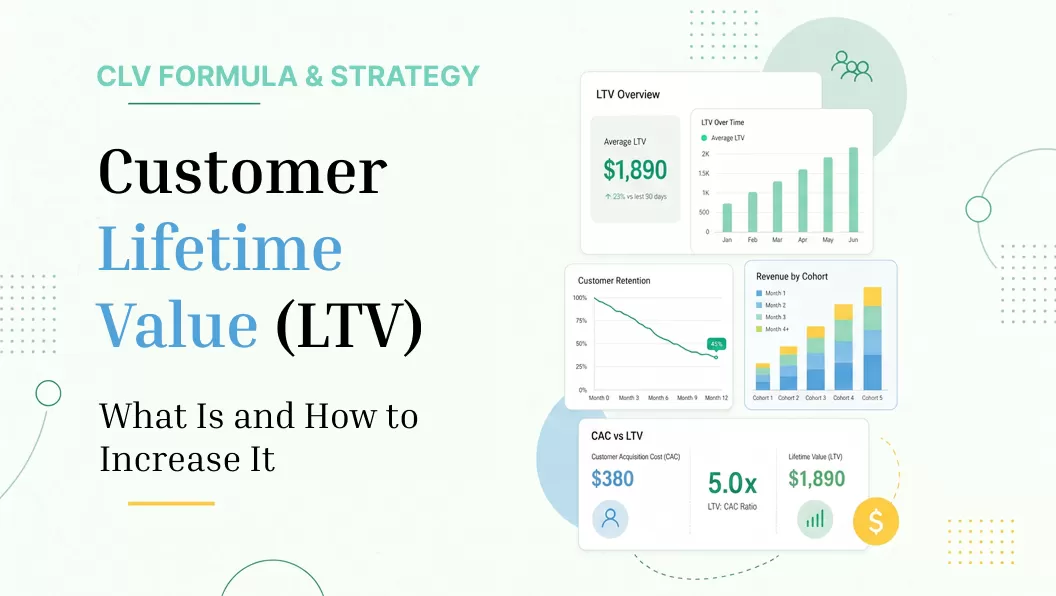
What Is Customer Lifetime Value (LTV) and Why Does It Matter?
Quick Definition
Customer Lifetime Value, LTV or CLV, is a metric that estimates the total revenue you can expect from a single customer throughout the entire period of your relationship. In essence, it takes the customer's revenue value and compares it to the predicted customer lifespan.
A higher LTV usually means your business is good at retaining customers, which also tends to reflect higher profits. A lower LTV is a sign that you need to work on customer retention.

LTV earns its place in the metrics stack for a few concrete reasons:
- Budget Allocation: Knowing how to calculate LTV makes you more efficient in budget allocation. If a customer is likely to bring you $1,000 over their lifetime, you can decide how much it's worth spending to acquire them.
- Strategic Planning: LTV is a metric you should factor into decisions about product development, pricing, and customer service. A higher LTV signals that customers are satisfied with your product and service.
- Customer Retention: LTV underscores the importance of customer retention. As you increase customers' LTV, your business's profitability rises with it.
- Attracting Investors: A higher LTV is a positive indicator of a company's potential, and investors look at it closely when evaluating your business.
How Do You Calculate Customer Lifetime Value?
The Standard Formula (for Ecommerce & Transactional Businesses)
 Formula
LTV = Average Purchase Value × Purchase Frequency × Customer Lifespan
-
Where:
- Average Purchase Value: Total Revenue ÷ Total Number of Orders.
- Purchase Frequency: Total Number of Orders ÷ Total Number of Customers, over a specific period.
- Customer Lifespan: How long, on average, a customer continues to purchase from your company (derived from your retention data).
The SaaS Formula: Why You Must Adjust for Gross Margin
For subscription and SaaS businesses, the most commonly used starting
point is LTV = ARPU ÷ Churn Rate (Average Revenue Per User
divided by your monthly churn rate). The problem is that this version
quietly treats revenue as if it were pure profit.
If a customer generates $100 in revenue but costs you $80 in hosting and support to serve, their real LTV is nowhere near $100. That's why this formula needs a gross margin correction before you use it to set an acquisition budget.
The SaaS-adjusted formula is LTV = (ARPU × Gross Margin) ÷ Churn Rate,
which accounts for the cost of serving a customer instead of treating
their entire subscription revenue as profit.
This single adjustment is what most basic LTV calculators get wrong, and it directly affects how you read your other key engagement metrics, including the LTV to CAC ratio covered next.
Common LTV Calculation Mistakes to Avoid
The Golden Rule: Understanding the LTV to CAC Ratio
An LTV:CAC ratio of roughly 3:1 is a commonly cited reference point in SaaS and ecommerce: it suggests you're getting three dollars of customer value for every dollar spent acquiring them. The healthy range shifts with your stage and industry, so treat it as a directional guide, not a pass/fail test.
The trap isn't the ratio itself. It's what founders do when their real ratio comes in closer to 1:1. A common move is to keep the formula the same but inflate the assumptions feeding it: "our ratio looks bad today, but once feature X ships next year, LTV will jump." That's not a calculation anymore, it's a story, and it quietly masks a business model that isn't healthy yet.
Before you change your CAC assumptions to chase 3:1, check your pricing and cost structure first. A healthier ratio usually comes from fixing margin or retention, not from optimistic math.
Beyond the CAC ratio trap, four other mistakes distort most LTV calculations:
- Treating Revenue as Profit (Ignoring Gross Margin): Counting a customer's full revenue as their value, without subtracting what it costs to serve them, overstates LTV (see the SaaS formula correction above).
- Relying on a Single Company-Wide Average (The Segmentation Trap): Calculating one blended LTV for your entire customer base hides huge differences between, say, annual vs. monthly subscribers, or paid-ad vs. organic customers. Averaging them together leads you to overspend on weak channels and underspend on strong ones, and segmenting customers by behavior instead of using one flat number is what fixes this.

- Ignoring the Time Value of Money (NPV) for Long Customer Lifespans: $100 a month for 5 years is not the same as $6,000 today. Money collected years from now is worth less than money in hand. If your average customer lifespan runs past two years, discount future revenue back to its present value before you use LTV to set a spending budget.
- Assuming Unrealistic Linear Growth Forever: A model that assumes 4% monthly revenue growth alongside a 0.4% monthly churn rate will mathematically produce a 20-year customer lifespan, a number that exists only on a spreadsheet. Always cap your growth and retention assumptions at a realistic ceiling (for example, revenue flattening out after 12 months) instead of letting the formula run uninterrupted.
How to Model LTV at Different Stages of Your Business?
Just Launched? Use the Naive Estimation Method
If you haven't launched yet, or you don't have enough churn data to trust, none of the formulas above will work: there's no real retention rate to plug in. Instead, use a naive estimate: take your expected ARPU and multiply it by a conservative, hand-picked lifespan (six months or one year is a common starting point). The goal at this stage isn't precision, it's getting a directional number you can act on while you collect real data.
Have Retention Data? Build a Cohort Retention Curve
Once you have a few months of real usage data, stop assuming churn is a flat, constant rate. Customer churn is almost never linear. The first month after signup typically has the highest churn, and customers who make it to month six tend to churn much more slowly from then on. Building a cohort analysis (tracking retention by signup month) gives you the actual curve instead of a single average, which is what makes segmented retention tracking so much more reliable than a one-size-fits-all churn rate.

How Can You Improve Your Customer Lifetime Value? 7 Data-Driven Strategies
Knowing your number is only half the job. Here are seven ways to move it.
- Enhance Customer Experience: Streamline your checkout by reducing steps and offering multiple payment options. Back that up with fast, reliable support across multiple channels, the kind of experience that removes reasons to leave rather than adding reasons to stay.
- Increase Average Order Value: Cross-sell complementary products so customers buy more than they originally intended, bundle items together at a discount, and use volume discounts (like "buy two, get one free") to encourage larger orders.
- Personalize Your Marketing Efforts: Segment your audience into groups with shared interests and needs, then use behavioral data to send each group recommendations that actually match how they shop instead of one generic campaign for everyone.
- Implement a Loyalty Program: Reward customers for referring friends and family, and give your most loyal customers exclusive perks: early access to new products, special discounts, or free shipping.
- Utilize Deep Linking: Deep linking sends customers straight to the exact content or screen they care about, not a generic homepage. Fewer steps between intent and purchase means less friction at every touchpoint.
-
Automate Win-Back Campaigns for At-Risk Customers:
Don't wait until a customer has fully churned to react.
According to our customer testimonial, a mobile game studio used behavior-based tracking to flag players showing early signs of disengagement, then triggered personalized, automated outreach before they left for good. The result was a 45% lift in click-through rate and a 20% increase in the rate of churned players returning. - Use Predictive Analytics: Use historical behavior data to forecast which customers are likely to churn or expand, instead of treating every customer the same way. The only way to know which of these levers is working for your specific customer base is to measure them. Not all seven will move the needle equally, and some won't move it at all.


What to Look for in an LTV-Focused Platform
Each of these strategies can move LTV on its own. The problem is that when each strategy is triggered manually, measured in isolation, and owned by a different team, the result is short-term lifts that don't compound. What turns individual tactics into a lasting LTV improvement is a platform that ties segmentation, automation, and analytics into a single continuous system.
Is a platform right for you?
You probably don't need one yet if: you have a small
customer base, run a single acquisition channel, or are still validating
product-market fit. At that stage, a spreadsheet and a few manual
campaigns will get you further than adding infrastructure overhead.
A platform starts to pay off when: you're managing
multiple channels and segments simultaneously, your team is spending
more time stitching tools together than running campaigns, or you have
enough retention data to act on cohort-level insights, but not enough
bandwidth to act on them manually.
EngageLab, an omnichannel marketing automation platform built for that second stage. Here's what it gives you:
-
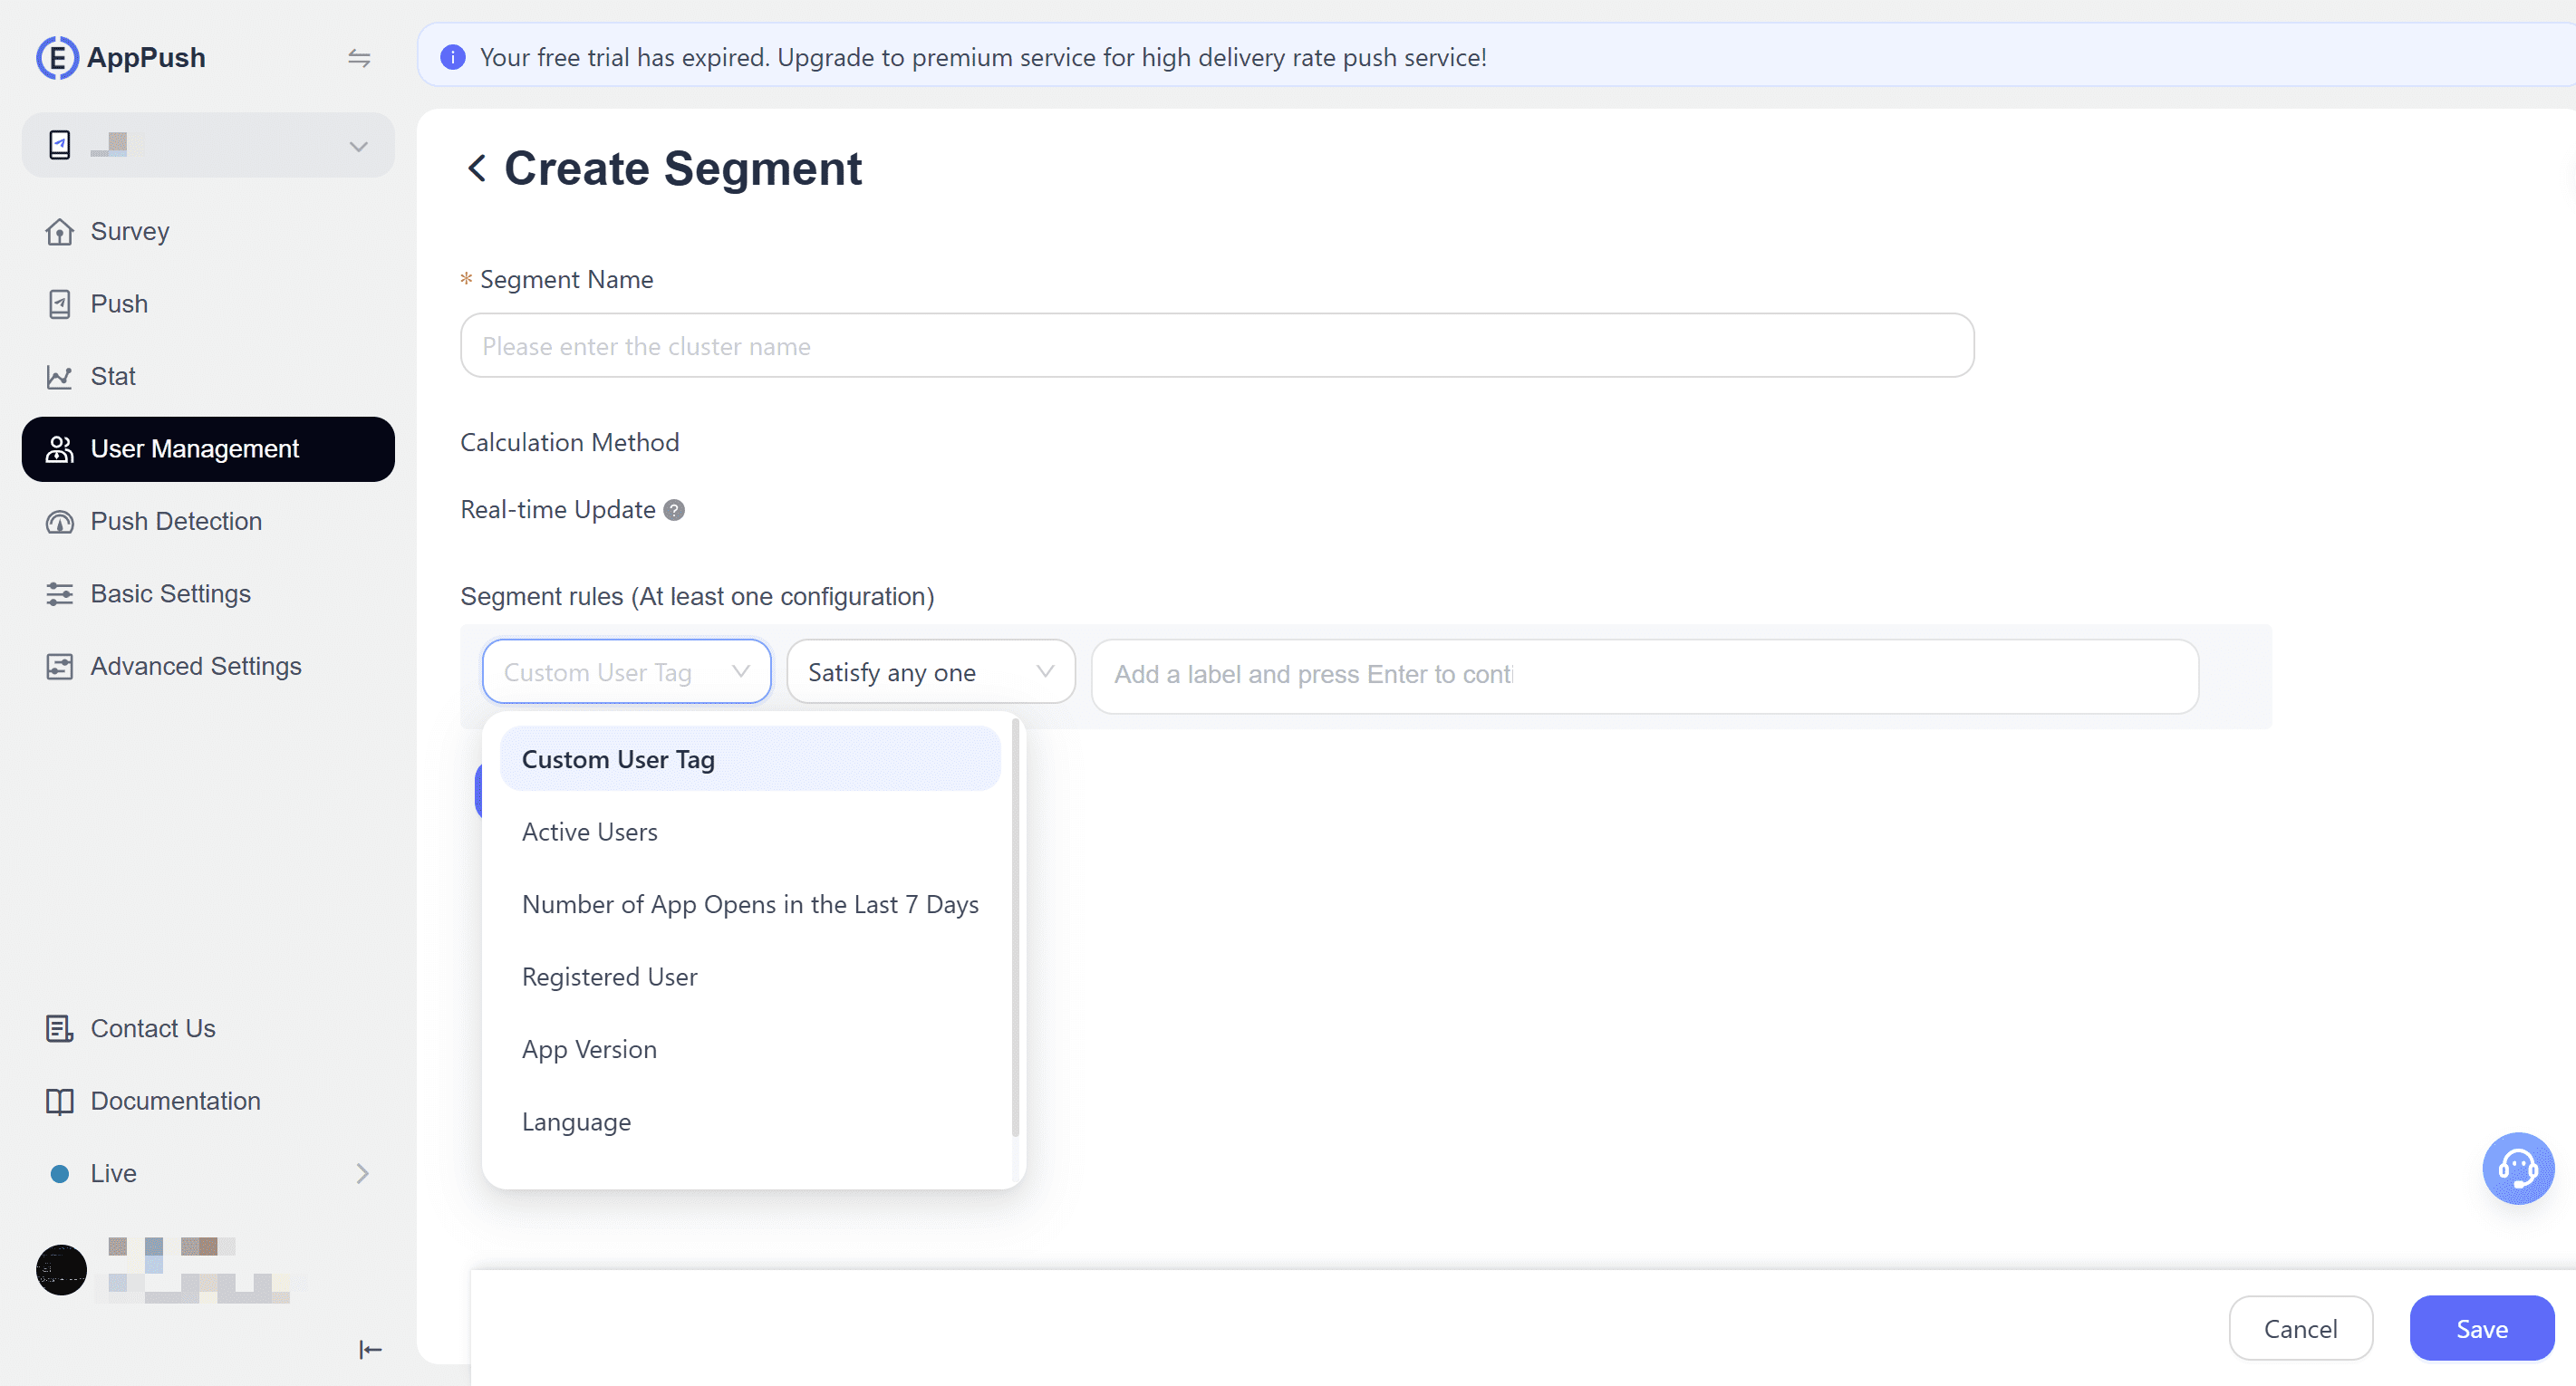
Per-Channel Contact Management and Segmentation:
Each channel — App Push, Web Push, Email, SMS, and WhatsApp — has
its own contact base and segmentation configuration. You can target
different audiences on different channels, or use behavioral data to
build segments that feed into your automated journeys.
-
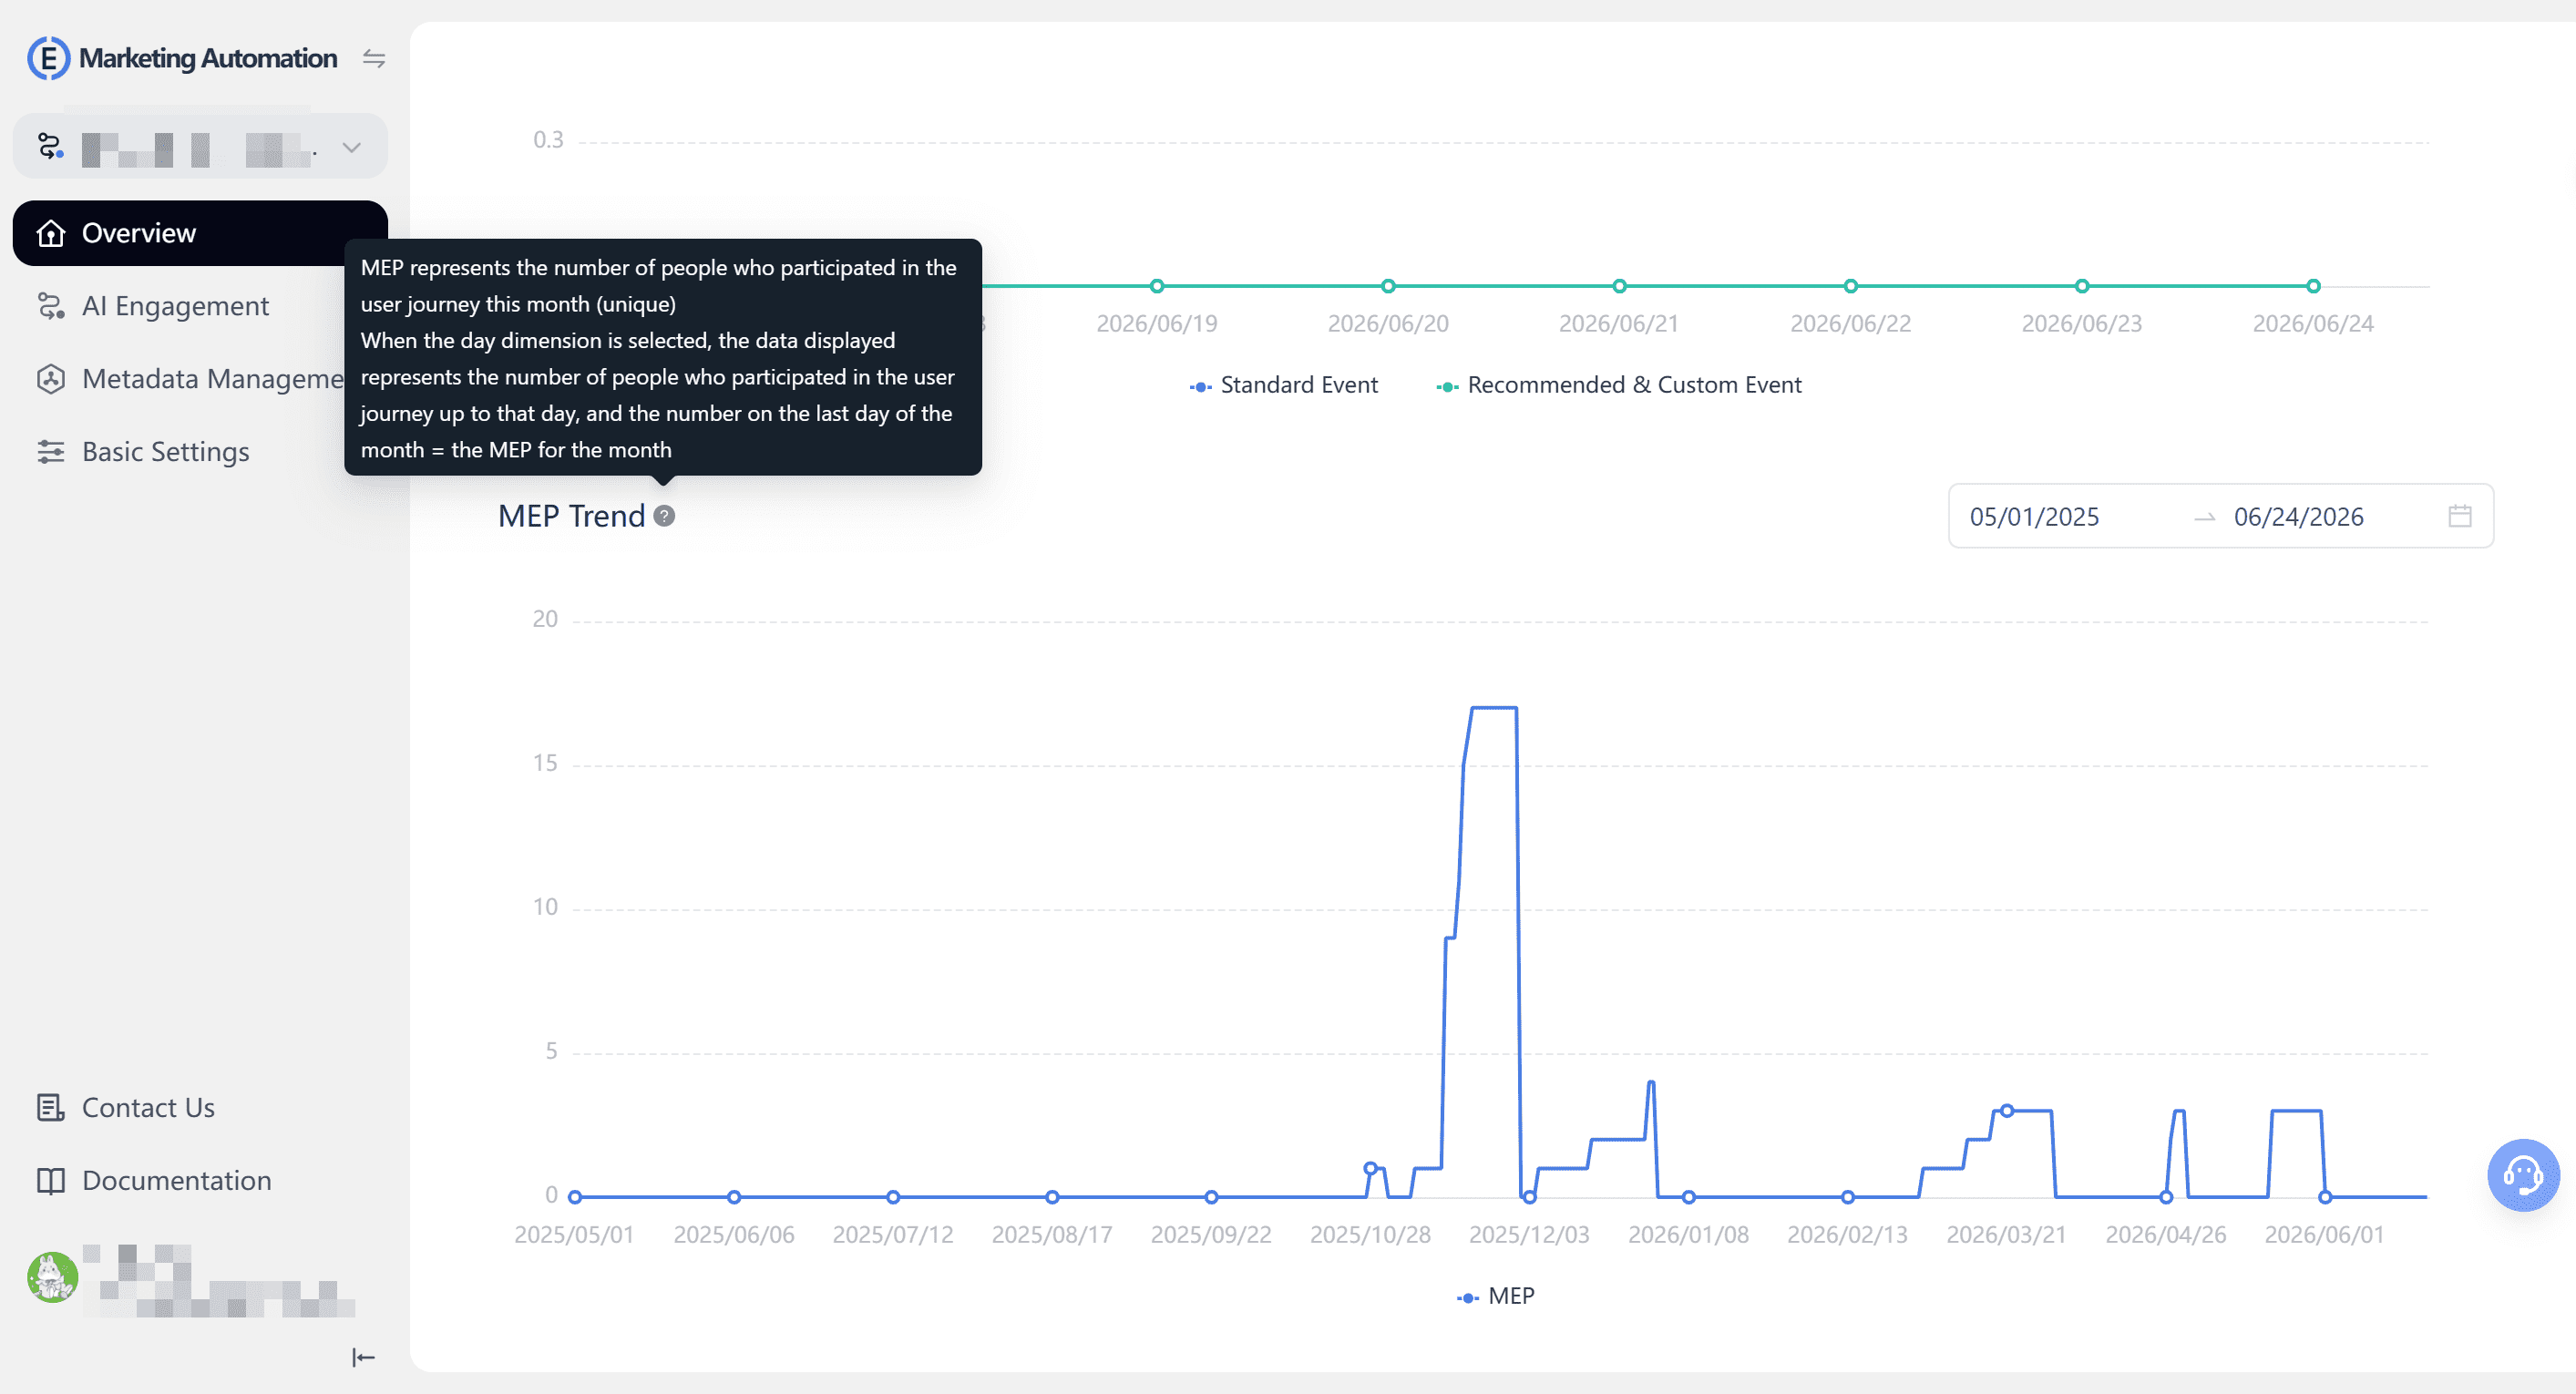
Channel-Level Reporting and Journey Analytics:
Each channel has its own delivery and engagement dashboard, covering open rates, click-through rates, and
drop-offs. At the journey level, the MEP dashboard tracks participation, goal completions, and revenue
conversion per channel, so you can see which part of the automation is actually driving LTV and which isn't.
-
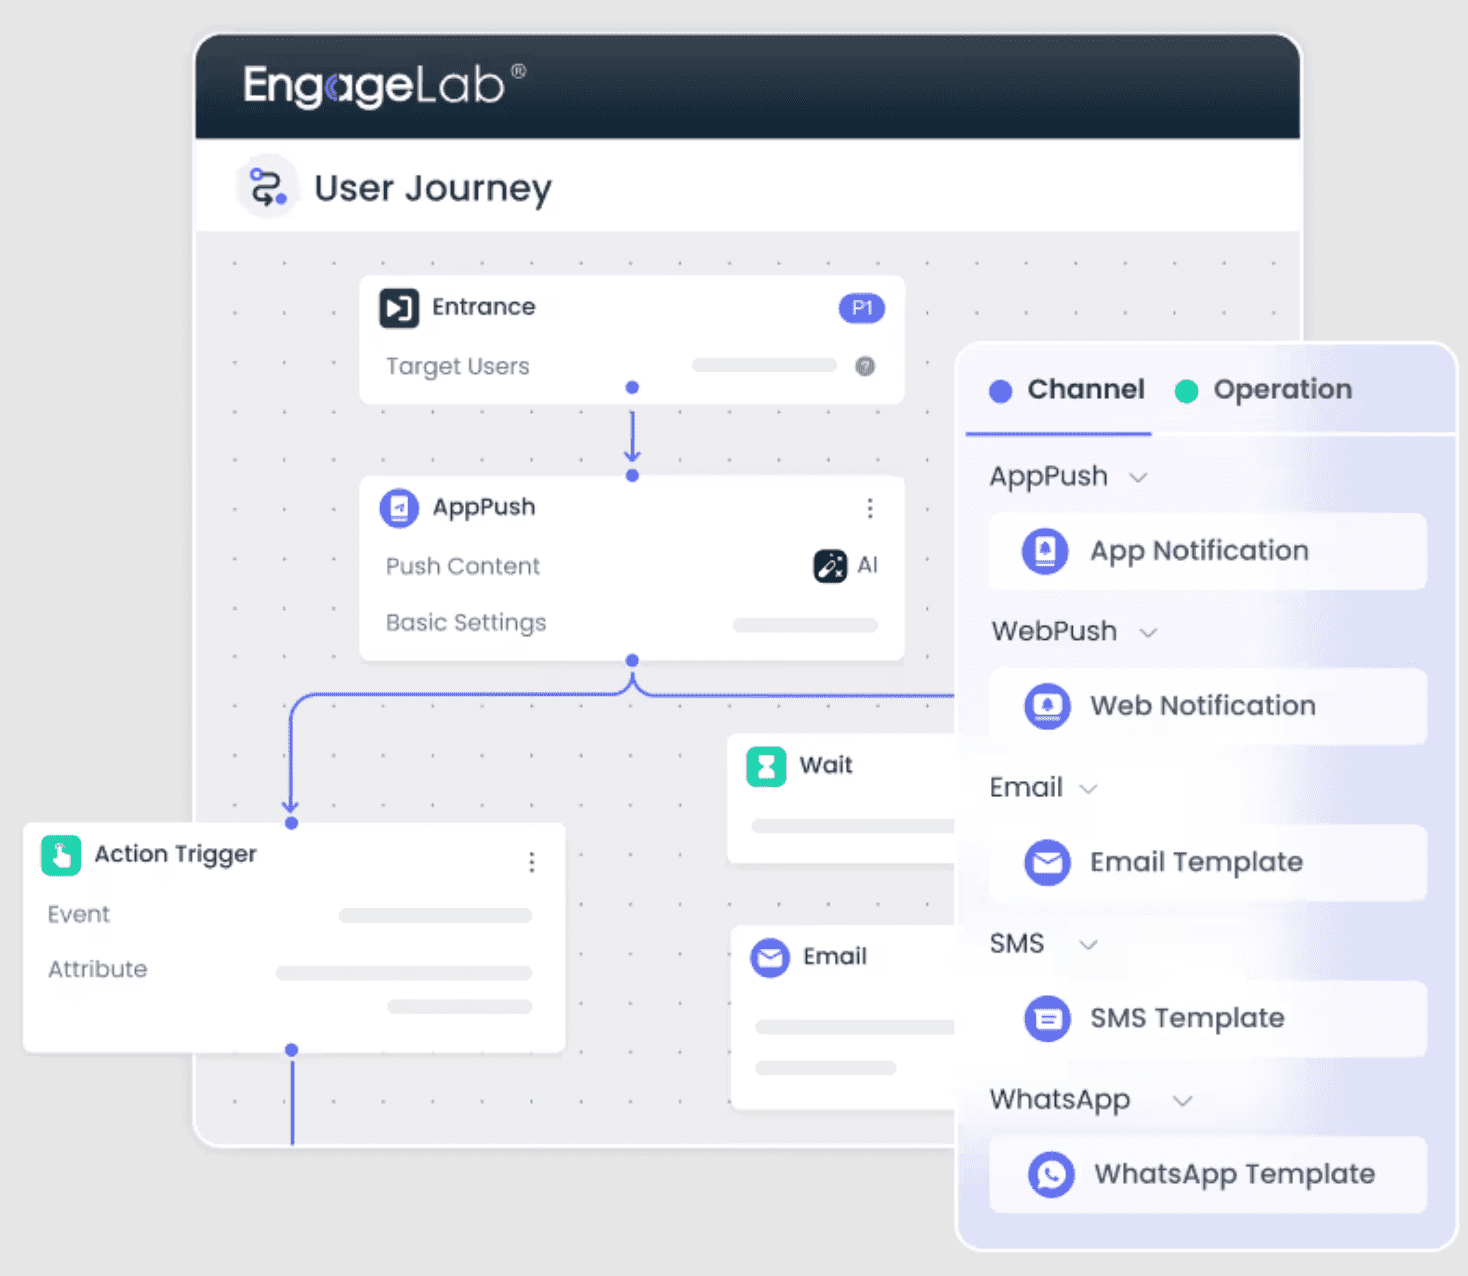
Automated Multi-Step Journey Builder:
Design behavior-triggered journeys visually, set the entry
condition, choose the channel mix (push, email, WhatsApp), and
let the automation run. The win-back result above came from this
exact workflow.
- Predictive Analytics for Forecasting: Forecast future customer behavior from historical data instead of guessing at growth and retention assumptions.


Marketing automation is what ties these capabilities together into a single, ongoing system rather than a series of disconnected one-off campaigns.
Try For FreeFrequently Asked Questions
What Is a Good LTV to CAC Ratio?
A ratio of around 3:1 is the most commonly cited benchmark in SaaS and ecommerce, meaning you generate roughly three dollars of customer value for every dollar spent on acquisition. The right number for your business depends on your stage and industry, and it should never be forced by inflating future assumptions. Fix the underlying margin or retention issue instead.
How Do You Calculate LTV for a SaaS Business?
Start with LTV = ARPU ÷ Churn Rate, then correct it for gross margin: LTV = (ARPU × Gross Margin) ÷ Churn Rate. The gross margin adjustment matters because subscription revenue isn't pure profit — hosting and support costs need to come out first.
How Can You Increase Customer Lifetime Value?
The most effective levers are improving customer experience, increasing average order value through cross-selling and bundling, personalizing marketing by segment, running loyalty and referral programs, and automating win-back journeys for customers showing early signs of churn.
Putting LTV to Work
LTV isn't just a number to report — it's a working input for budget allocation, pricing, and retention strategy. The math isn't the hard part. What's harder is resisting the urge to inflate assumptions when the number looks bad, and remembering to revisit it as you move from naive estimates to real cohort data.
Turn customer retention into measurable lifetime value.