


LiveDesk Conversations
The LiveDesk "Conversations" page provides an overview of the project's overall service data, making it suitable for viewing conversation volume, message volume, and handling efficiency over a selected period.
How to Use
After selecting a date range and reporting granularity, you can further filter the data using the conditions available on the page. The charts display trends for the selected time range, helping you observe changes in service volume and efficiency.
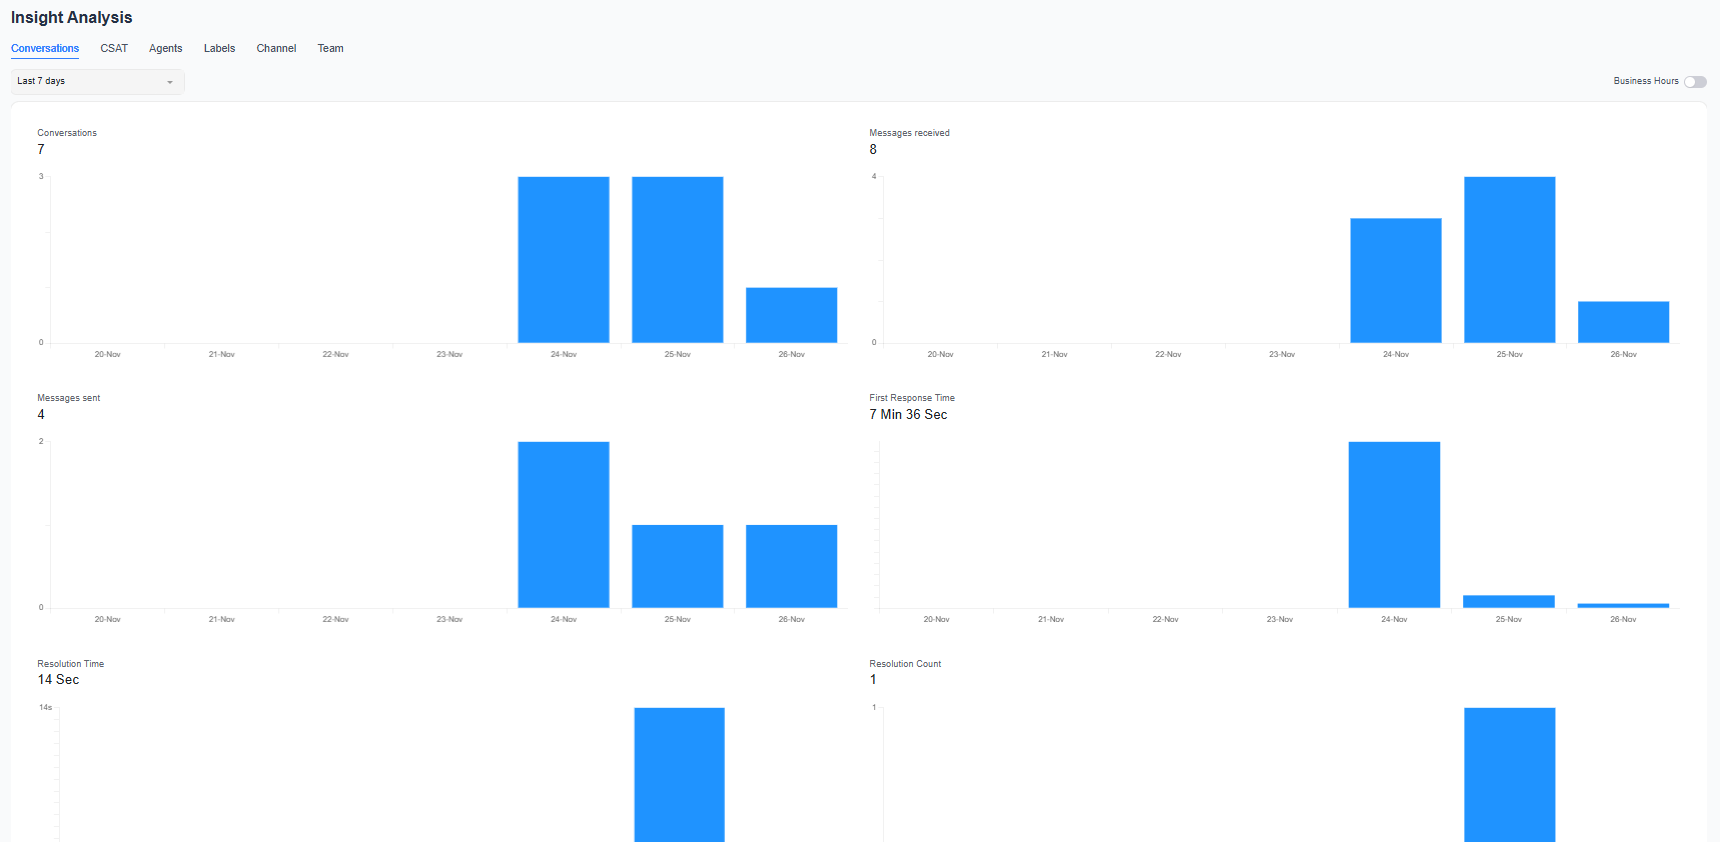
Core Metrics
| Metric | Description |
|---|---|
| Number of Conversations | The number of conversations within the selected time range |
| Messages Received | The number of messages sent by customers to the team |
| Messages Sent | The number of messages sent by the team to customers |
| Average First Response Time | The average waiting time before customers receive their first reply after sending their initial message |
| Average Resolution Time | The average time required to process and resolve a conversation |
| Number Resolved | The number of conversations resolved during the selected period |
| Customer Wait Time | The amount of time customers spend waiting for a reply from customer service |
Recommendations
- Use the number of conversations and messages to understand whether service volume has changed.
- Use first response time and customer wait time to determine whether customers are receiving timely responses.
- Use resolution time and the number resolved to evaluate the team's case-resolution efficiency.
- If you need to further analyze peak periods, human-AI collaboration, or response time distribution, use the "Performance" page.
This page is suitable for viewing overall trends. The statistical timestamps for different metrics may vary. For example, the conversation creation time and conversation resolution time are not always on the same day. The LiveDesk Conversations page provides an overview rather than detailed event-level analysis.
