


Statistical Analysis
Open the Statistical Analysis page to view authentication usage, success rates, failure reasons, and consumption costs for the current Silent Auth application. The page contains the Usage Analysis, Auth Analysis, and Consumption Analysis tabs. Charts and detailed data update when you switch applications or change the filters.
Usage Analysis
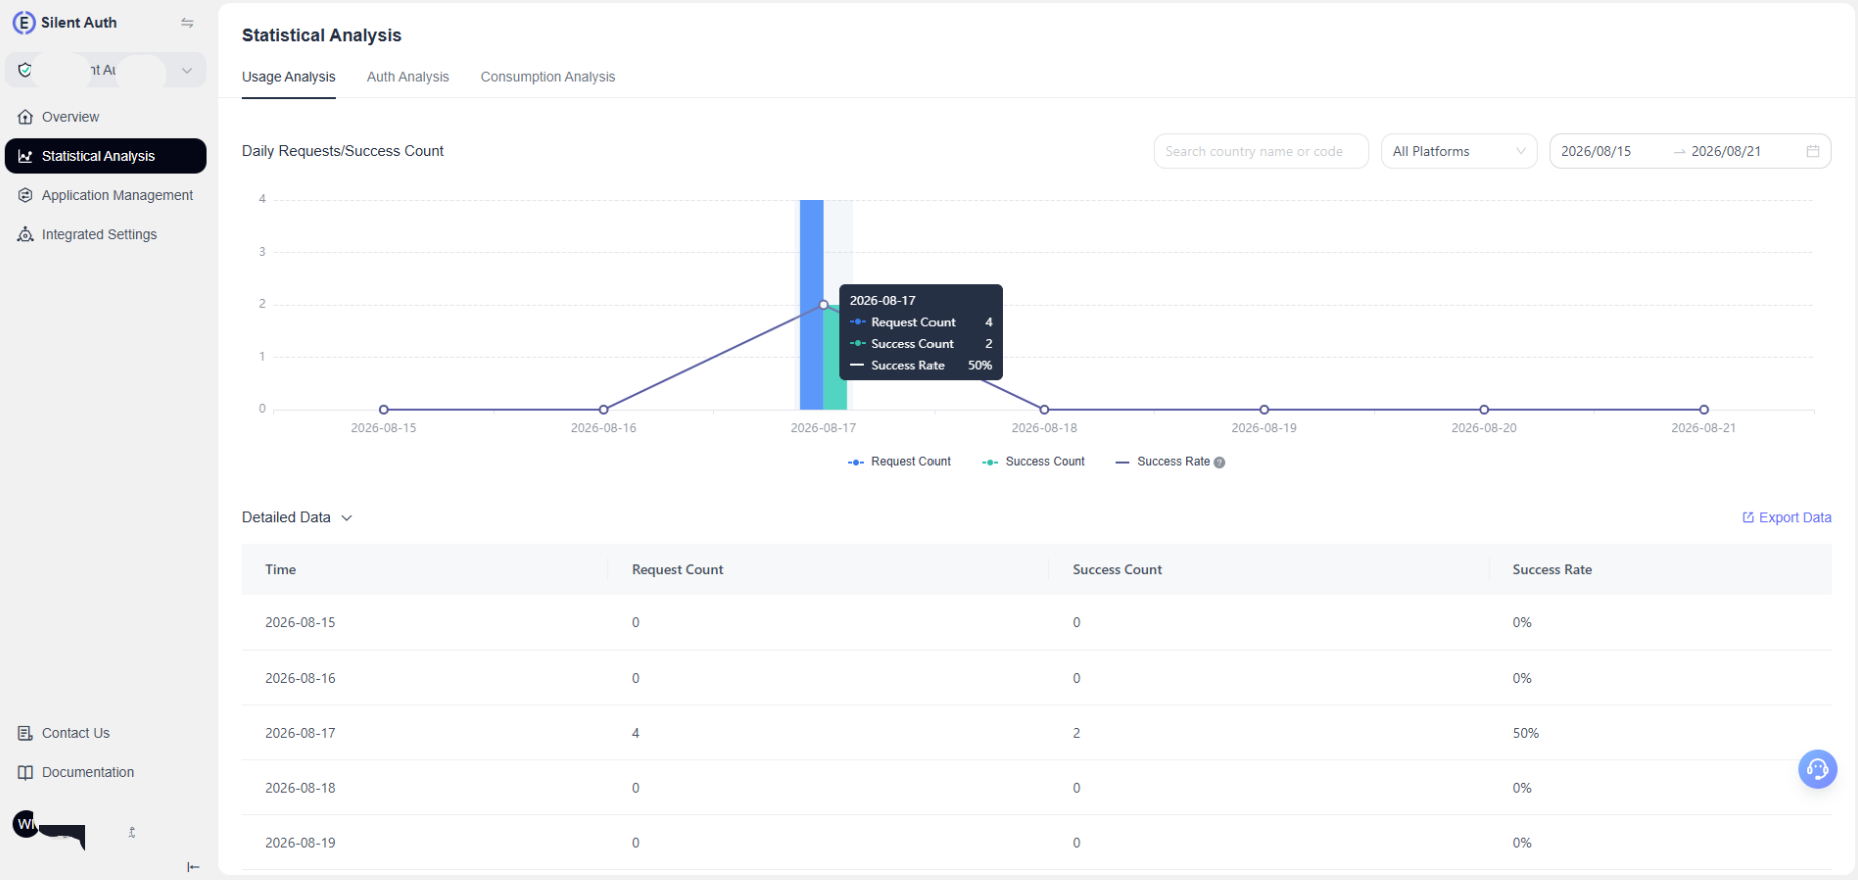
Open Statistical Analysis > Usage Analysis to view daily authentication requests, successful authentications, success rates, trends, and detailed data. You can filter by country, platform, and date. For the country filter, enter an English country name or country code and select up to five countries.
- Requests: Number of authentication requests initiated.
- Successful Authentications: Number of successful authentications.
- Success Rate: Successful Authentications ÷ Requests.
Hover over a data point to view the requests, successful authentications, and success rate for that date.
Detailed Data
The section below the chart shows the date, requests, successful authentications, and success rate for each day.
Export Data
Click Export Data on the right to export usage details for the current filters.
Auth Analysis
Open Statistical Analysis > Auth Analysis to view the success rate and failure reasons for each authentication stage. You can filter by platform and date, with a maximum date range of 30 consecutive days per query.
Success Rate Statistics
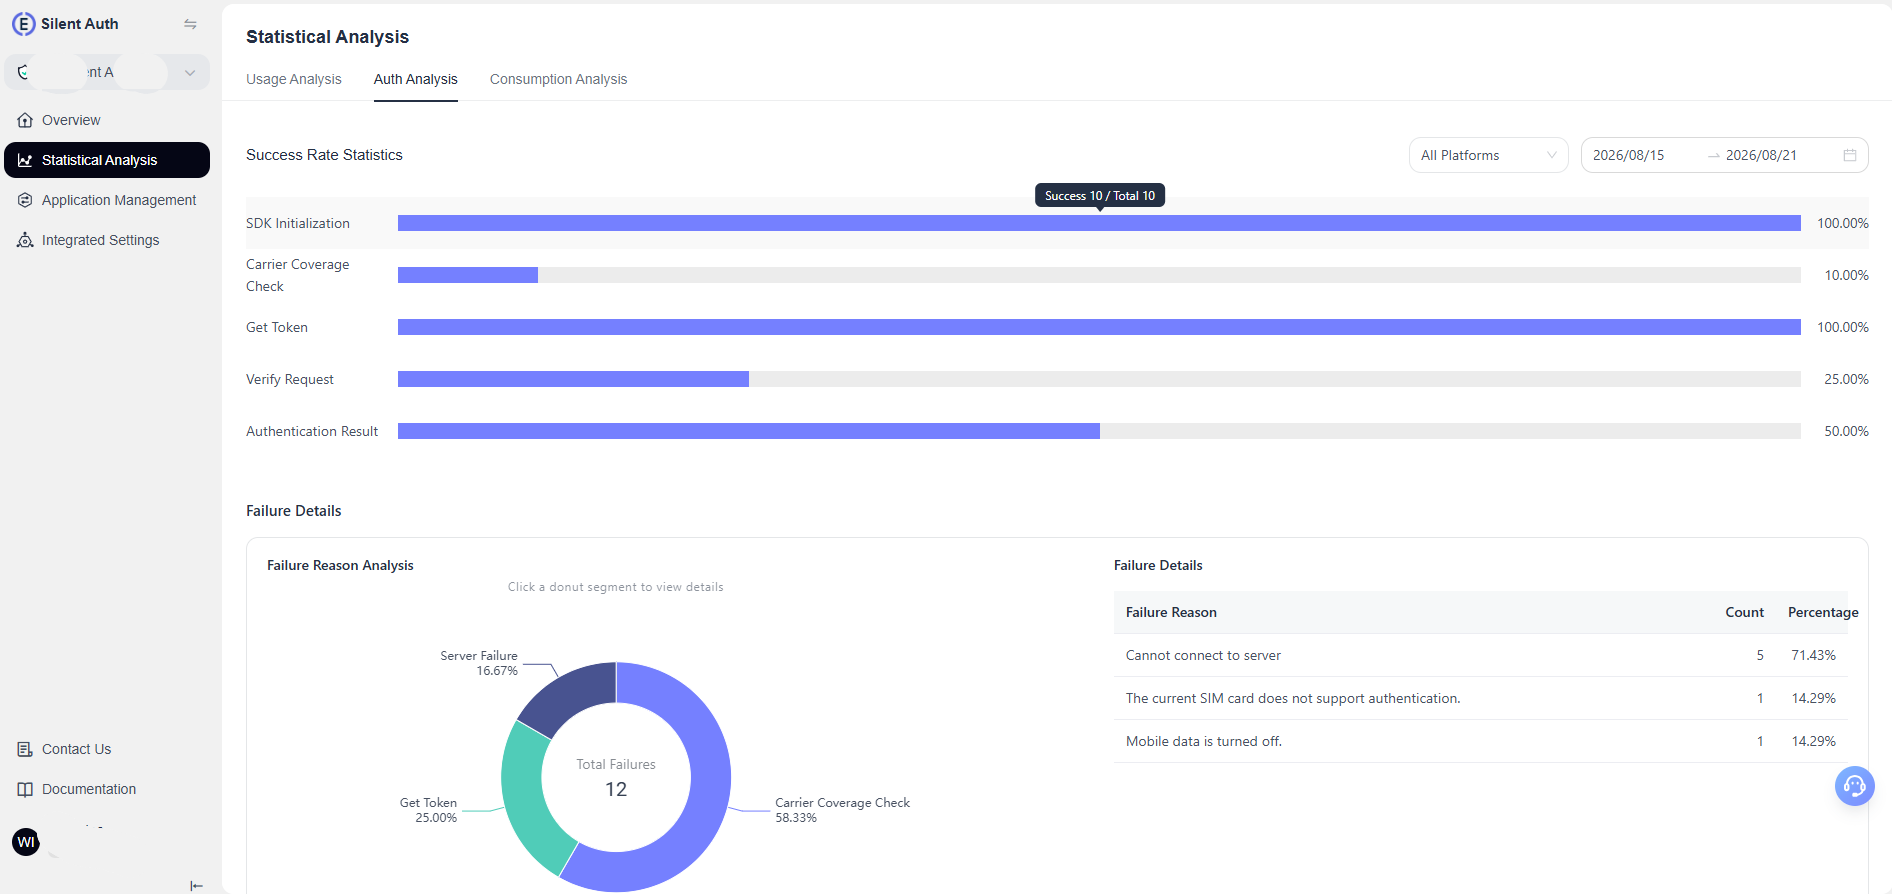
The authentication process is displayed in the following stages. Each stage shows its success rate and successful attempts/total attempts:
- SDK Initialization: Percentage of successful SDK initializations.
- Carrier Coverage Check: Percentage of checks confirming that the current number and carrier support authentication.
- Get Token: Percentage of attempts in which the SDK successfully obtains an authentication credential from the carrier.
- Authentication Request: Percentage of authentication requests successfully delivered to the server.
- Authentication Result: Percentage of authentication requests that are ultimately successful after reaching the server.
Failure Details
The section below shows the total authentication failures and their distribution for the selected period:
- Failure Reason Analysis: A donut chart shows the percentage of each failure reason. Click a segment to view its details.
- Failure Details: Shows each failure reason, failure count, and percentage.
Consumption Analysis
Open Statistical Analysis > Consumption Analysis to view daily consumption costs and successful authentications. You can filter by country and date. For the country filter, enter an English country name or country code and select up to five countries.
Consumption Amount Trend
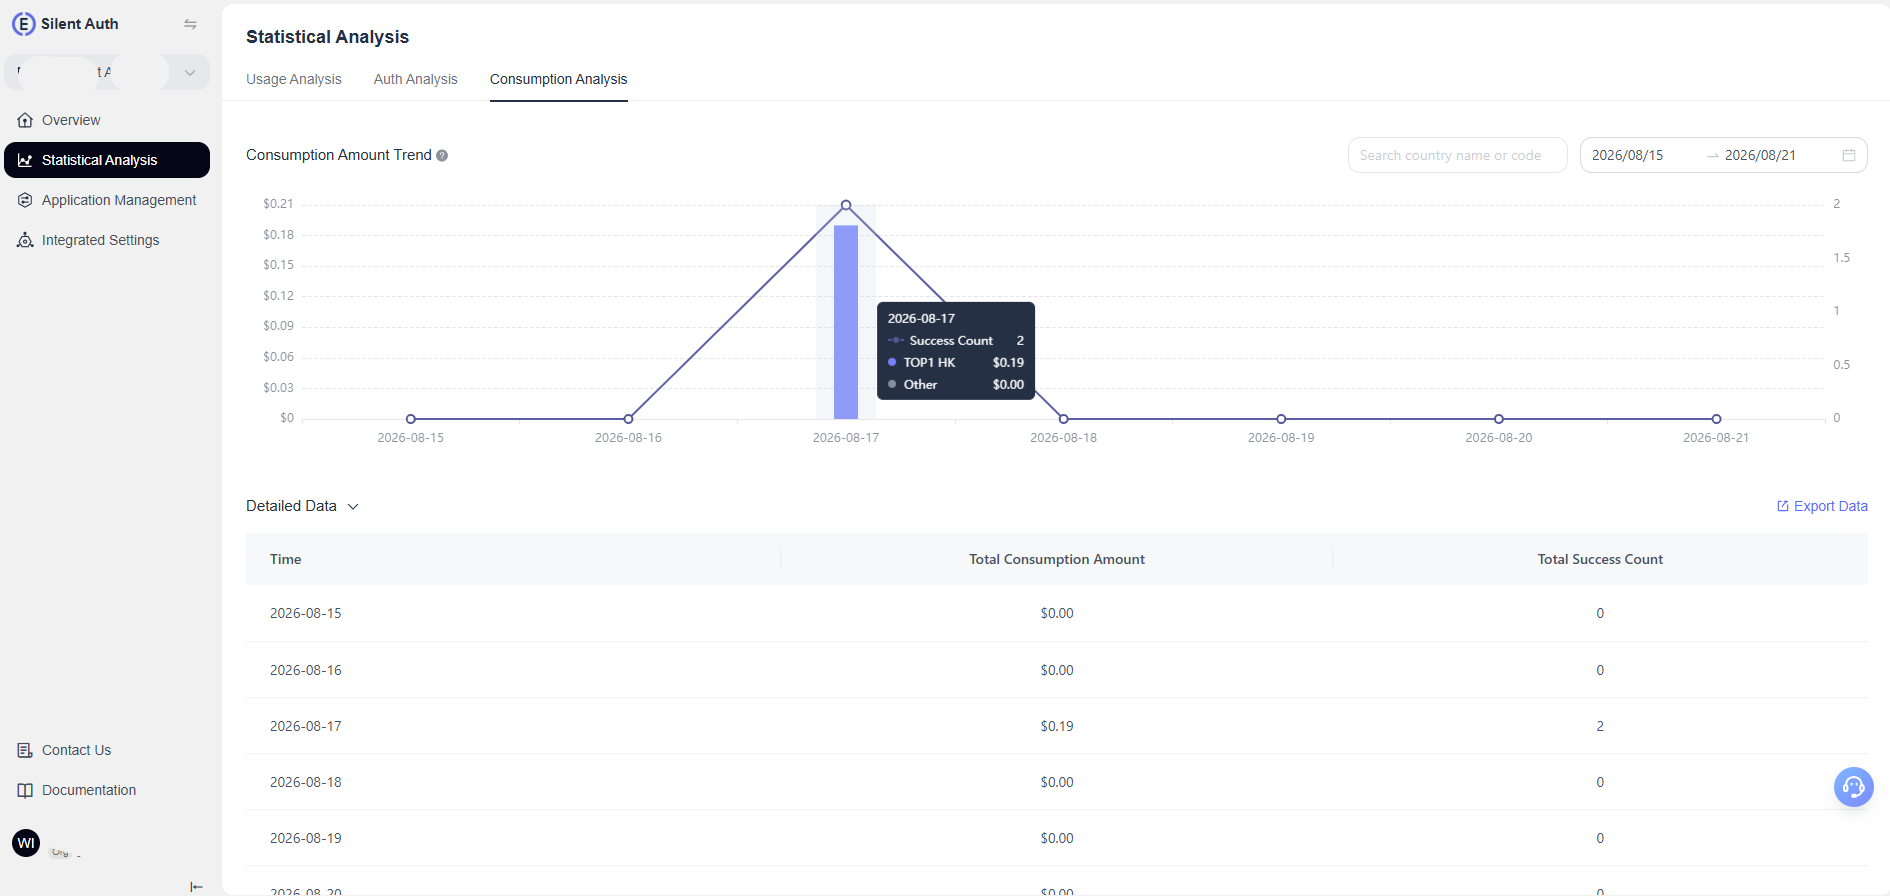
- Stacked bar chart: Shows daily consumption costs. The top five countries by consumption amount are shown separately for each day, and all remaining countries are grouped as Other. Rankings are calculated independently for each calendar day.
- Line chart: Shows daily successful authentications.
- Left Y-axis: Consumption amount in USD.
- Right Y-axis: Number of successful authentications.
Hover over the chart to view the successful authentications, consumption amounts for the top countries, and consumption amount for other countries on that date.
Detailed Data
The section below shows the total consumption amount and total successful authentications for each day.
Export Data
Click Export Data on the right to export data for the current date and country filters. The export includes:
- Summary: Total consumption amount and total successful authentications.
- Country Details: Daily consumption amount, successful authentications, and daily ranking for each country.
If you have questions or encounter an issue, contact EngageLab technical support.
