Análisis de insights
El análisis de insights se compone de los módulos "Conversaciones", "CSAT", "Agentes", "Etiquetas", "Canales" y "Equipos". Los datos se actualizan en tiempo real, lo que facilita comprender los tiempos de respuesta y resolución de las conversaciones, la carga de trabajo de los agentes, la calidad del servicio y las evaluaciones de satisfacción del cliente, lo que ayuda a los responsables a ajustar los planes de servicio y a tomar decisiones de gestión de equipos.
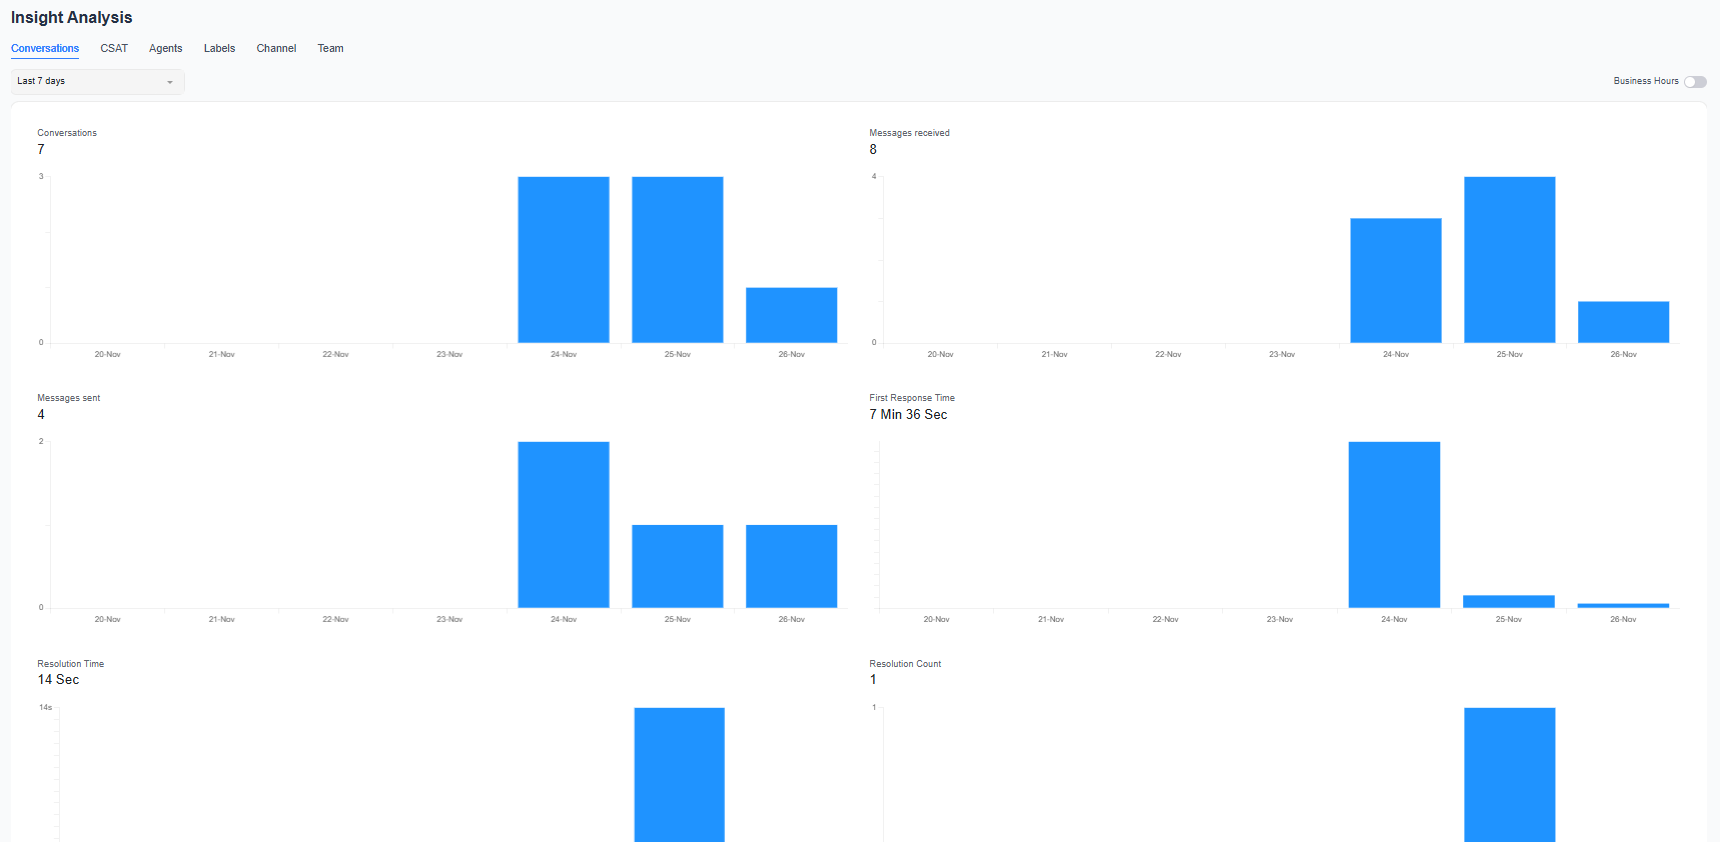
Conversaciones
Permite consultar estadísticas sobre el número de conversaciones, mensajes recibidos, mensajes enviados, tiempo hasta la primera respuesta, tiempo de resolución, número de conversaciones resueltas y tiempo de espera del cliente en un intervalo de tiempo personalizado, y muestra los resultados en gráficos de barras.
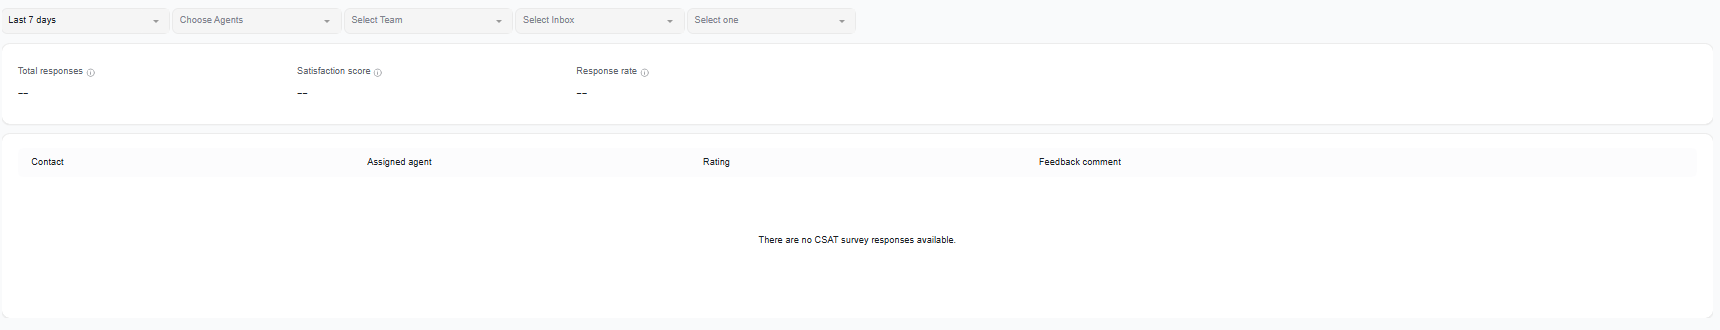
CSAT
Permite consultar los datos de satisfacción del cliente, incluidos el total de respuestas, la puntuación de satisfacción y las métricas de tasa de respuesta. Se puede ver el agente asignado, la valoración y los comentarios por contacto del cliente.
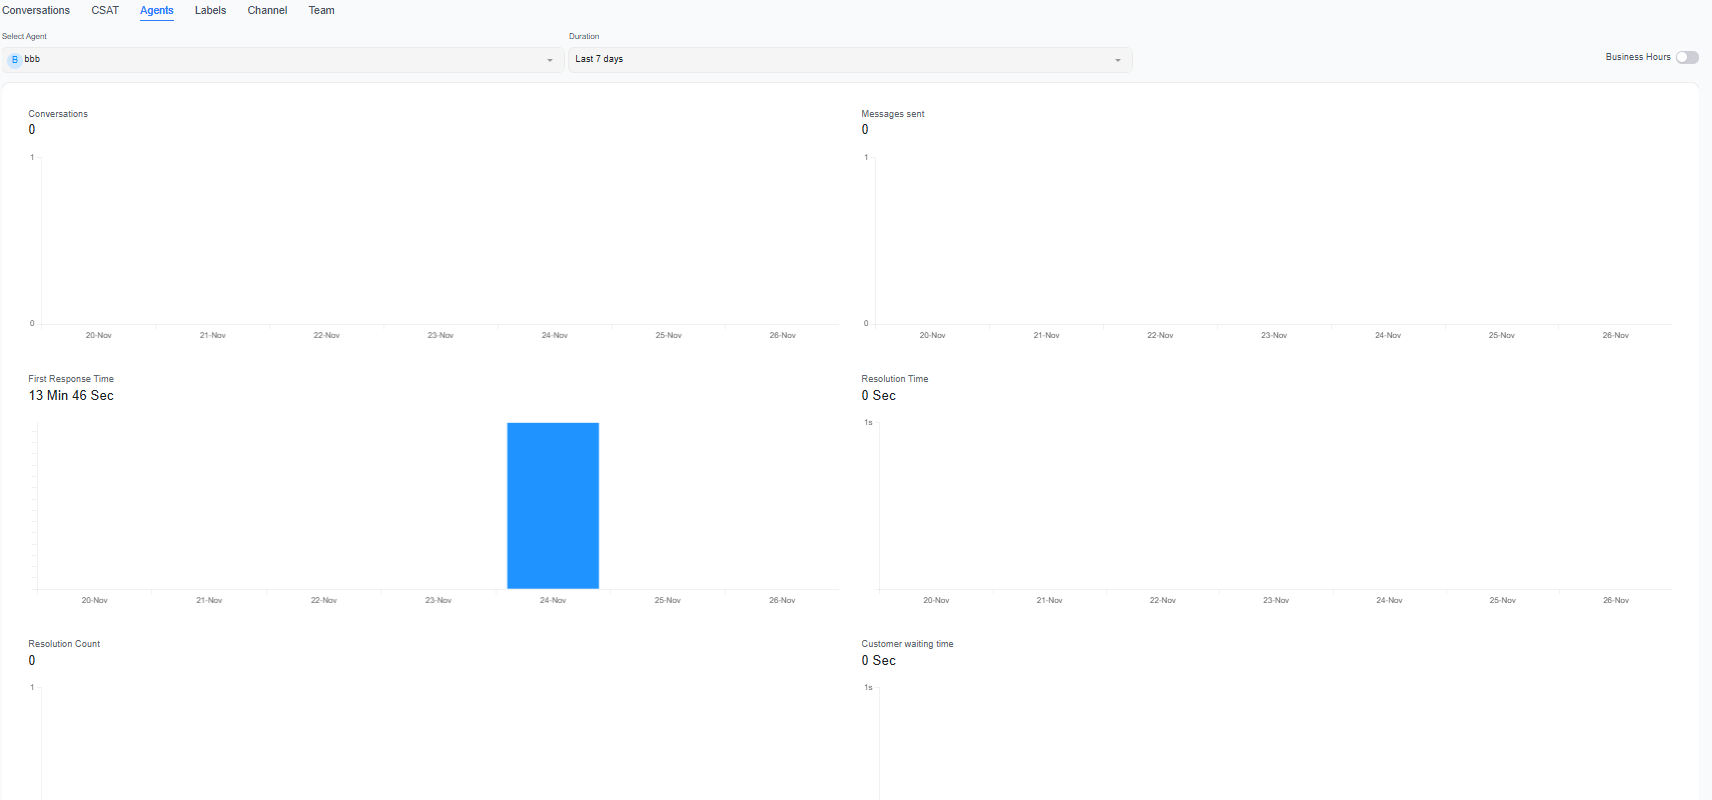
Agentes
Permite consultar estadísticas sobre el número de conversaciones, mensajes recibidos, mensajes enviados, tiempo hasta la primera respuesta, tiempo de resolución, número de conversaciones resueltas y tiempo de espera del cliente de un agente específico en un intervalo de tiempo personalizado, y muestra los resultados en gráficos de barras.
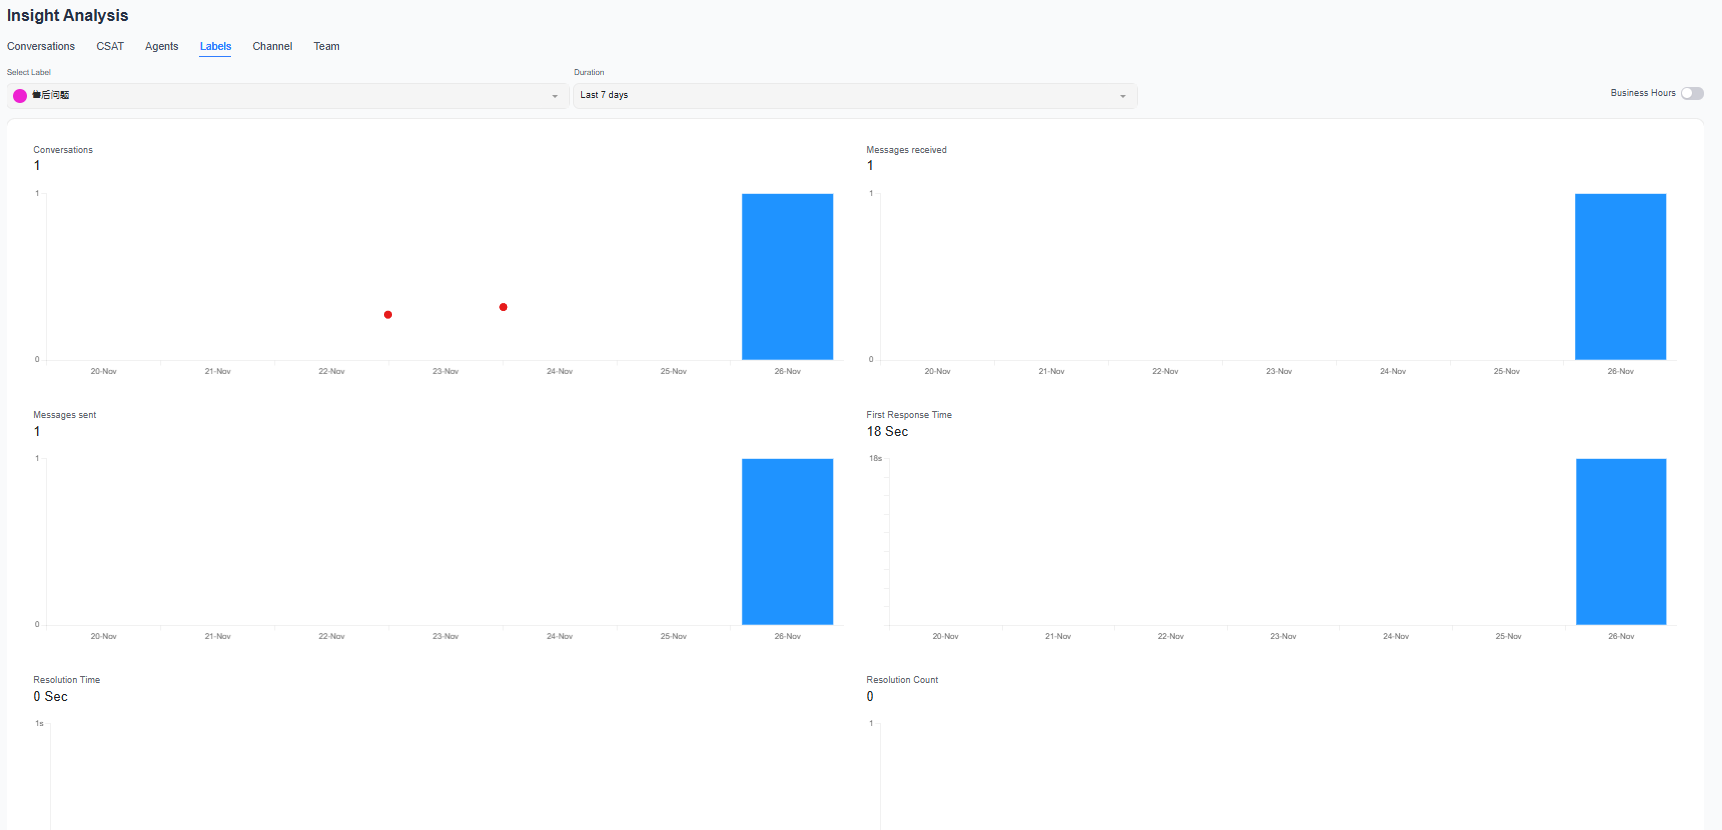
Etiquetas
Permite consultar estadísticas sobre el número de conversaciones, mensajes recibidos, mensajes enviados, tiempo hasta la primera respuesta, tiempo de resolución, número de conversaciones resueltas y tiempo de espera del cliente de una etiqueta específica en un intervalo de tiempo personalizado, y muestra los resultados en gráficos de barras.
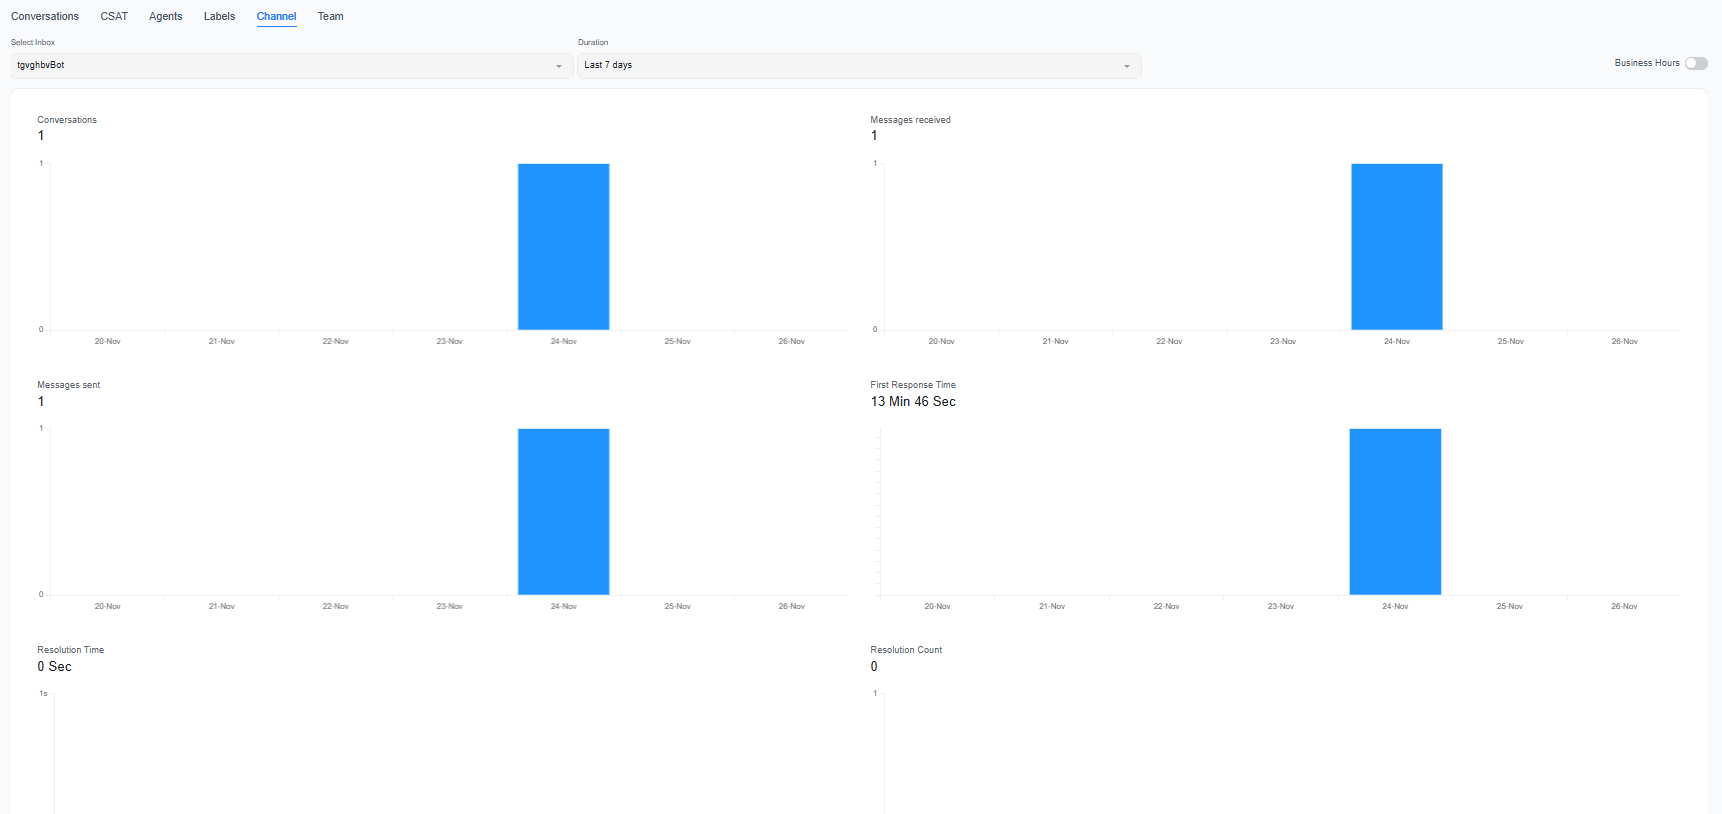
Canales
Permite consultar estadísticas sobre el número de conversaciones, mensajes recibidos, mensajes enviados, tiempo hasta la primera respuesta, tiempo de resolución, número de conversaciones resueltas y tiempo de espera del cliente de un canal específico en un intervalo de tiempo personalizado, y muestra los resultados en gráficos de barras.
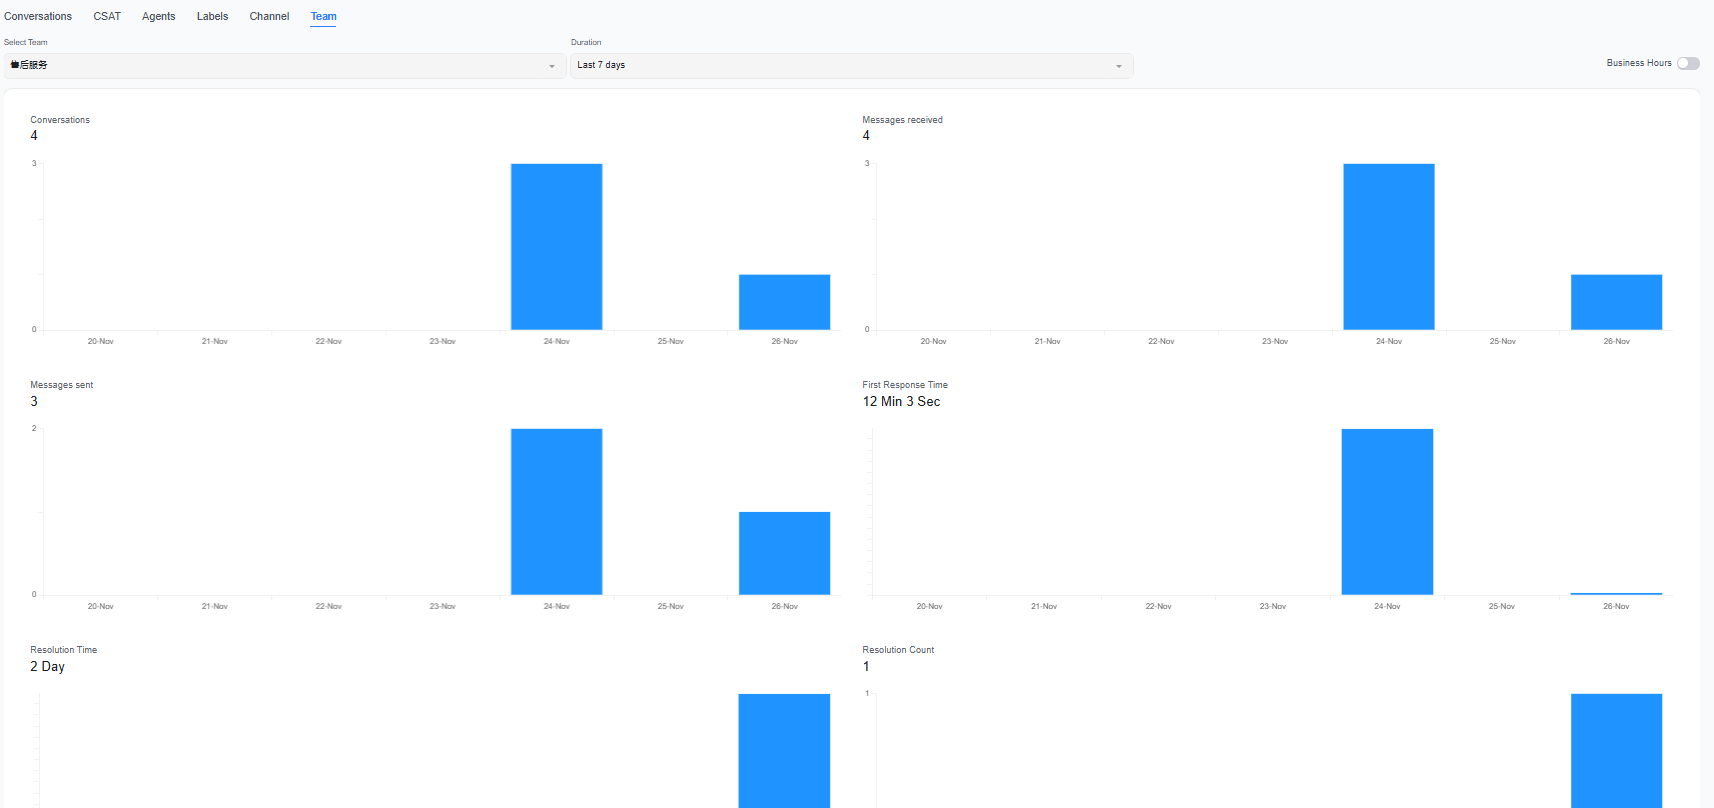
Equipos
Permite consultar estadísticas sobre el número de conversaciones, mensajes recibidos, mensajes enviados, tiempo hasta la primera respuesta, tiempo de resolución, número de conversaciones resueltas y tiempo de espera del cliente de un equipo de soporte específico en un intervalo de tiempo personalizado, y muestra los resultados en gráficos de barras.